
Pity the copier.
Stuck in the windowless corner of the teacher’s room, churning out page after page of quizzes, newsletters, and course descriptions. Probed and shoved and slammed, the oft maligned copier needs a break.
What could teachers do to lessen the toll that results in the overheated roller or stapler malfunction?
Stop the madness….there is no reason to copy a graphic organizer!
The graphic organizer is meant to help students prepare for another activity…a discussion, a quiz, or an essay. Graphic organizers can be used at any grade level. Graphic organizers can be used in any subject. But, teachers, please…. most graphic organizers do not need to employ a copier.

Who cannot draw the T-chart?
Take the T-Chart here at left. The T-Chart consists of two lines, a long horizontal line that is bisected by a vertical line. Why does this need to be prepared and run through a copier? Students can draw a T-Chart easily, or fold a paper “hot-dog style” to get the same result. What part of the T-Chart necessitates the use of expensive toner?
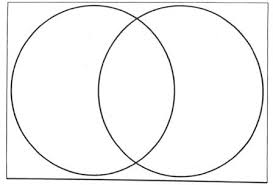
Venn Diagram-Perfect circles can be problematic
Consider next, the popular Venn Diagram used for compare and contrast exercises. Of all the organizers, this is one that may require students to have little practice to get perfect, however, is the symmetry of shape what teachers want students to notice about the Venn Diagram? That there are two perfect circles overlapping with a shared oval in the center? The problem with two perfect circles of equal size and shape is the implication that when an object or topic is compared and contrasted, the information is also equitable. On a prepared Venn Diagram, there is exactly the same amount of space on each side for the purpose of contrast, but there is a smaller, cramped center for comparable attributes. Perhaps a student can practice some freehand circle creation, find out how to use a protractor, or use some object -a water bottle? cup? paper plate?-to trace a circle. What students should not fret about is how to draw two perfect circles, because the Venn Diagram functions as an organizer even with lopsided ellipses.
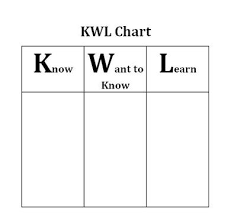 Then, there is the popular K-W-L chart, where students list what they know, what they want to know, and what they learned. This graphic organizer is much like the T-Chart, and even the youngest student can draw vertical two lines on a page. Folding a paper into thirds is also an effective way to achieve a K-W-L organizer without have to wait for the teacher in front of you to finish copying next month’s math worksheets. Having students write the headings for this chart can reinforce the purpose of the organizer as well.
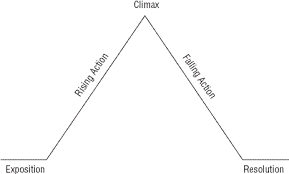
Plot Mountain diagram
Next, the “plot mountain” diagram is a staple in English Language Arts classrooms, but as a universal tool in deconstructing literature, the organizer has its flaws, so much so that the replication could make its use damaging. Some plots have long expositions (Return of the Native by Thomas Hardy comes to mind); some have short expositions (Shakespeare’s Romeo and Juliet‘s opening sonnet). One of arguably several climaxes for Harper Lee’s To Kill a Mockingbird is the courtroom scene which is followed by a long falling action (four chapters) before Bob Ewell’s climatic attack on Scout. There is no falling action in The Tell-Tale Heart by Poe which ends at the climax. These few examples demonstrate that each story has its own construction, its own mountain; plot is not a one size fits all, as this organizer would seem to claim. For this reason, teachers should allow students to sketch their own version of a story’s plot mountain, featuring all the little crags and mini-climax moments in rising and in falling. Teachers should save the plot mountain as a flexible concept, one that is not enhanced by standardized reproduction.
 Finally, there is the “four-square” organizer, used to provide attributes on a topic that is printed in the center. The object is to think of details that fit specific categories or boxes in each of the paper’s four quadrants. Think of a big cross in the center of the paper, or a paper folded in half vertically, and then folded again horizontally. This organizer is often used in word study, as in the Frayer model, with a word in the center and each box used for a specific purpose: an illustration, an example, a definition,or an antonyms are all possible categories for this organizer.

Guru Mind Map on Wikipedia
Using the copier to create these organizers not only is expensive in toner ink and valuable teacher time (spent trying to get that last crinkled bit of paper out of the feed drawer!), but these organizers limit critical thinking for some students.
Students should be given the opportunity to organize their ideas the way that best helps them understand a concept. They should be cognitively and kinesthetically active in creating and completing an organizer of their own design
Mind maps, for example, are original creations that are centered on a concept that is drawn or written on the center of a blank landscape or page. From this central concept or word, an individual can branch out on the page by adding using words or pictures that show other connections. No two mind maps are the same, and their use in improving student understanding is well documented. My favorite mind-mapping website is Daniel Weinstein’s The Creativity Core with variations on mind-mapping activities for his students.
So, teachers, step away from the overheated copying machine, and get out blank paper and markers. Let the students fold their paper to make graphic organizers, trace shapes, or choose other patterns to list information. Bring out the rolls of butcher block paper and let students try and map out their ideas. Let them pencil their thoughts in wobbly circles and uneven lines, because the use of the graphic organizer is not about the shape for the information, but the information that is organized in the shape.
And leave that copier for the more important duties….those field trip permission slips!


Filling out graphic organizers in the primary grades is often cumbersome as students don’t quite have the fine motor skills to write fluently. This shouldn’t deter teachers from filling out the GO on a chart for all students to see. A GO in progress is a wonderful tool to refer back to when lessons continue throughout the week. Students now have a visual to look at that will help them summarize and refer back to when discussing a text.
A T-chart can be posted and students can contribute to it by placing a “sticky note” under a column e.g. New Learning vs. Surprised Learning. With all the knowledge that is going into our young learners’ heads, we need to assist them in sorting and managing what is learned through read alouds, shared reading, science, social studies, and independent reading.