Archives For November 30, 1999

One of the first literary elements that students understand as they begin to read is character.  They learn that a character is a person, animal, being, or thing moving the story along a plot line. Many of the characters in books they can read independently have recognizable traits:

  • The Pigeon in Don’t Let the Pigeon Drive the Bus is always stubborn and demanding;
  • Horrible Harry of the Horrible Harry Series is always rebellious.
  • Jack Smith of The Magic Treehouse Series is always smart and courageous.
  • Judy Moody of the Judy Moody Series is always determined and…well, moody.

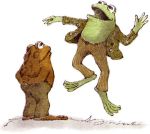
The characters in series books at these elementary grade levels (K-3) are predictable. Students are able to practice reading because they are familiar with characters such as Ramona, Dog Man, Nate the Great, Captain Underpants, Amelia Bedelia, and Frog and Toad.

These characters’ thoughts and feelings may shift when they react to different problems or conflicts. But these characters do not change. They are static; they are not complex characters.

The dominance of static characters in the elementary grades can be an issue when students are faced with an assessment question:

“How did [the character] change? What caused this change?”

This particular question comes from the Teacher’s College Grade 3 Reading Units of Study, but other literacy programs also ask about character change.

It is important to understand that the word “change” is synonymous with a radical, transformative process. The etymology of the word change (c.1300) is “to undergo alteration, become different.” The Collins dictionary defines change as:

1. to put or take (a thing) in place of something else; substitute for, replace with, or transfer to another of a similar kind
2.  to give and receive reciprocally; exchange; switch
3. a. to cause to become different; alter; transform; convert 
    b. to undergo a variation of

The kind of change in character that matches this transformative meaning is difficult to find at the lower reading levels. A well-crafted character who “converts” or “alters” in a low-level text is unusual for any combination of reasons including choices in brevity, vocabulary, and text structure.

For most students who are reading at or below a Grade 3 reading level, there are few complex texts that they can independently read to determine a character change. Instead, the characters in the book series that are favored by students such as  Geronimo StiltonThe Boxcar Children, or Ivy and Bean, are intentionally crafted by authors so the characters remain the same while the plot or the settings change.

There are exceptions, of course. The Grinch in Dr. Seuss’s classic story (not film) The Grinch that Stole Christmas undergoes a transformational character change, but at the Lexile 731/level P,  the book is most often used in the classroom as a read-aloud. There are few mentor texts like the Grinch that can give students the opportunity to practice for an assessment on character change.

The limited number of stories with complex characters at the lower grade levels means that students do not have enough independent practice on their own with this concept. The leap from the predictable characters in a series (Babymouse, Henry& Mudge, Little House on the Prairie) to the kind of complex character change that is found in Maddie in Eleanor Estes The Hundred Dresses or in Jonas in Lois Lowrey’s The Giver can be a high bar for many elementary or even intermediate readers.

So, why ask students at the lower elementary levels about character change at all? The phrase “character change” does not appear in the ELA Common Core State Standards (CCSS) until Grade 6 when students should:

“…describe how a particular story’s or drama’s plot unfolds in a series of episodes as well as how the characters respond or change as the plot moves toward a resolution. (RL.6.3)”

Instead, the CCSS states students in grades 3-5 should be able to:

  • describe characters (traits, motivations, or feelings) and “explain how their actions contribute to the sequence of events” (RL.3.3 )
  • describe character, setting, or event in a story or drama, drawing on specific details in the text ( a character’s thoughts, words, or actions (RL.4.3)
  • compare and contrast two or more characters, settings, or events in a story or drama, drawing on specific details in the text (RL.5.3)

Maybe the intent of asking students at the lower elementary levels about character change is to prepare students for the complex texts they will read in the upper grades. If this is the case, there should be some consideration of what resources could be used to support this kind of character study, especially as most books in elementary reading libraries feature characters that are purposefully crafted to be static. The characters are designed to be familiar to allow students to practice fluency and accuracy. Asking students to find evidence to show a character change when there is no change is an inauthentic exercise.

There is also a danger in assessing a student’s understanding of character change too soon in their literary lives. Teachers also should be careful not to elevate what is a shift in a character’s attitude to be equal to a  change in character. Guiding elementary students to answer “character change” by using evidence that shows how a character may think or feel differently can muddy a later understanding of what character change really means.

Students should not have to answer assessment questions that ask for evidence of character change where there is none. Instead, at the lower grade levels, students should be ready to answer assessment questions that draw attention to the differences in a character’s attitude, thoughts or feelings:

  • “How did the character react to the problem?”
  • “What caused the character’s reaction?”
  • “What are the character’s thoughts and feelings now?”
  • “Does this character have a different attitude?”

Most of the books in elementary school libraries can support these kinds of questions, which are closely aligned to the ELA CCSS for grades K-5. Finding the evidence that shows a difference in a character’s attitude, thoughts, or feelings is a task that elementary students can do in both mentor texts and in their leveled reading.

Identifying a character’s shift in attitude can also help students better understand the theme or message of the book, for example:

“Yes, this is where I want to be! The Circus is the place for me.” –Put Me in the Zoo. 

“Pete, you don’t need magic sunglasses to see things in a new way! Just remember to see the good in everyday!” Pete the Cat and the Magic Sunglasses

“And for all I know he is sitting there still, under his favorite cork tree, smelling the flowers just quietly. He is very happy.”-The Story of Ferdinand

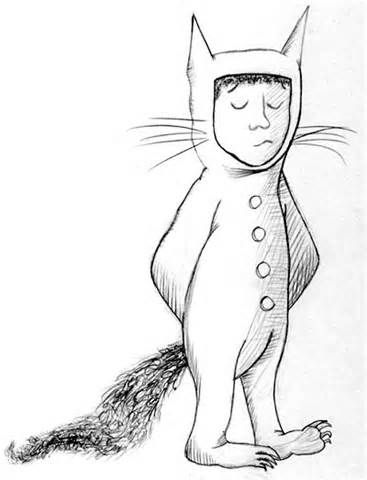
Of course, there are those iconic characters who have been designed to be so static that a question about a difference in attitude, thoughts or feelings is pointless. Just ask Max of Where the Wild Things Are.  He is still in his wolf suit when he returns home “where he found his supper waiting for him and it was still hot.” Continue Reading…

Notice how I am trying to beat the character limit on headlines?

Here’s the translation:

For your information, Juniors: Connecticut’s Common Core State Standards Smarter Balanced Assessment [Consortium] is Dead on Arrival; Insert Scholastic Achievement Test

Yes, in the State of Connecticut, the test created through the Smarter Balanced Assessment Consortium (SBAC) based on the Common Core State Standards will be canceled for juniors (11th graders) this coming school year (2015-16) and replaced by the Scholastic Achievement Test  (SAT).

The first reaction from members of the junior class should be an enormous sigh of relief. There will be one less set of tests to take during the school year. The second sigh will come from other students, faculty members, and the administrative team for two major reasons-the computer labs will now be available year round and schedules will not have to be rearranged for testing sessions.

SAT vs. SBAC Brand

In addition, the credibility of the SAT will most likely receive more buy-in from all stakeholders. Students know what the brand SAT is and what the scores mean; students are already invested in doing well for college applications. Even the shift from the old score of 1600 (pre-2005) to 2400  with the addition of an essay has been met with general understanding that a top score is  800 in each section (math, English, or essay). A student’s SAT scores are part of a college application, and a student may take the SAT repeatedly in order to submit the highest score.

In contrast, the SBAC brand never reported student individual results. The SABC was created as an assessment for collecting data for teacher and/or curriculum evaluation. When the predictions of the percentage of anticipated failures in math and English were released, there was frustration for teachers and additional disinterest by students. There was no ability to retake, and if predictions meant no one could pass, why should students even try?

Digital TestingScantron

Moreover, while the SBAC drove the adoption of digital testing in the state in grades 3-8, most of the pre-test skill development was still given in pen and pencil format. Unless the school district consistently offered a seamless integration of 1:1 technology, there could be question as to what was being assessed-a student’s technical skills or application of background knowledge. Simply put, skills developed with pen and pencils may not translate the same on digital testing platforms.

As a side note, those who use computer labs or develop student schedules will be happy to know that SAT is not a digital test….at least not yet.

US Education Department Approved Request 

According to an early report (2006) by The Brooking’s Institute, the SBAC’s full suite of summative and interim assessments and the Digital Library on formative assessment was first estimated to cost $27.30 per student (grades 3-11). The design of the assessment would made economical if many states shared the same test.

Since that intial report, several states have left the Smarter Balanced Consortium entirely.

In May, the CT legislature voted to halt SBAC in grade ii in favor of the SAT. This switch will increase the cost of testing.According to an article (5/28/15) in the CT Mirror “Debate Swap the SAT for the Smarter Balanced Tests” :

“‘Testing students this year and last cost Connecticut $17 million’, the education department reports. ‘And switching tests will add cost,’ Commissioner of Education Dianna Wentzell said.”

This switch was approved by the U.S. Department of Education for Connecticut schools Thursday, 8/6/15, the CT Department of Education had asked it would not be penalized under the No Child Left Behind Act’s rigid requirements. Currently the switch for the SAT would not change the tests in grades 3-8; SBAC would continue at these grade levels.

Why SBAC at All?

All this begs the question, why was 11th grade selected for the SBAC in the first place? Was the initial cost a factor?

Since the 1990s, the  State of Connecticut had given the Connecticut Achievement Performance Test (CAPT) in grade 10, and even though the results were reported late, there were still two years to remediate students who needed to develop skills. In contrast, the SBAC was given the last quarter of grade 11, leaving less time to address any low level student needs. I mentioned these concerns in an earlier post: The Once Great Junior Year, Ruined by Testing.

Moving the SBAC to junior year increased the amount of testing for those electing to take the SAT with some students taking the ASVAB (Armed Services Vocational Aptitude Battery) or selected to take the NAEP (The National Assessment of Educational Progress).

There have been three years of “trial testing” for the SBAC in CT and there has been limited feedback to teachers and students. In contrast, the results from the SAT have always been available as an assessment to track student progress, with results reported to the school guidance departments.

Before No Child Left Behind, before the Common Core State Standards, before SBAC, the SAT was there. What took so them (legislature, Department of Education, etc) so long?

Every Junior Will Take the NEW SAT

Denver Post: Heller

Denver Post: Heller

In the past, not every student elected to take the SAT test, but many districts did offer the PSAT as an incentive. This coming year, the SAT will be given to every 11th grader in Connecticut.

The big wrinkle in this plan?
The SAT test has been revised (again) and will be new in March 2016.

What should we expect with this test?

My next headline?

OMG. HWGA.

This summer, I plan to spend time organizing question stems to spark critical thinking and post them on a number of slides to share with teachers.
OR
I could shorten the process and use just one slide. I could ask one question that is guaranteed to drive critical thinking. I could ask:

So what?”

To be honest, the first time I was asked this question in an academic setting, I was appalled. I felt I was being taunted. I was sure the professor was just being rude.

I was uncomfortable…I could not give an effective response.

“So what?”

I hated the question. I hated that the professor was goading me. I hated Dr. Steven D. Neuwirth. 

I was taking a graduate course (560) Literature of the American South, what I thought would be a “fun” course as I completed my Master’s Degree in English.

I remember distinctly the moment that was not fun…the evening of the second class.

“So what?” Dr. Neuwirth wrote on the chalkboard; he snapped a piece of chalk as he underlined the question for emphasis.

So what? he repeated in class after I offered what I thought was a brilliant observation on the evidence of dignity as a character trait in a discussion on William Falkner’s As I Lay Dying.

I was irritated. I had worked very hard on my responses.

So what? he scrawled in big letters on the paper I handed in three weeks later.

I was angry. I had worked even harder on that response.

My frustrations continued. Nothing in my training had prepared me for his persistence with the So what? question.

I had done what had worked in every other class. I had developed a thesis. I had used evidence. I had proved my thesis.

Regardless, my answers did not satisfy his challenge. So what? He found my reasoning lacking, and because he was not satisfied, neither was I.

I needed to think how to explain better.
I had to think differently.
I had to think critically.

It was then I realized that Dr. Neuwirth’s So what?” question was making me think critically.

Dr. Neuwirth’s irritating challenge brought me to recognize that it was not enough for me to develop and prove a thesis in a paper. I had to prove why my argument mattered.

For example, it was not enough to prove that Faulkner’s characters displayed dignity despite their social status, I had to question so what is the reader to take from his writing?

I had to ask the question So what?” not with attitude but with curiosity. Curiosity led to inquiry:

  • So what was my point? 
  • So what was missing from my response?
  • So what should I want the reader to know or do?
  • So what happens next?
  • So what do I do to cause or prevent something from happening ? 
  • So what makes this work or not work?
  • So what will this information lead me to study next?

Such inquiries led to me to make conclusions. I had always found conclusions difficult to write. I had always followed the predictable formula of restating the thesis, but I found that when I used the critical question So what? I could offer a broader conclusion.

For example, when I developed a thesis on the dignity of Faulkner’s characters and provided evidence from the text, I was really posing the question “Why should anyone read novels by Faulkner?” When I asked myself so what? I could conclude that Faulkner’s characters spark empathy in the reader.

It turned out that I did not hate theSo what? question.

I did not hate Dr. Neuwirth …although, admittedly, liking him took a little longer. While I did understand the importance of being challenged, I still found him a brilliant but abrasive teacher.

Four years after that class, I  became a teacher, and I taught literature. My students wrote predictable and boring conclusions that restated the thesis. They were not thinking critically. I had to do something.

Dr. Steven Neuwirth, Western Connecticut State University-created the University's Honors Program and served as its first director; he passed away February, 2004.

Dr. Steven Neuwirth, Western Connecticut State University-created the University’s Honors Program and served as its first director; he passed away February, 2004.

I asked my students So what?

And I scrawled So what? on their papers.

And I wrote So what? on the Smartboard -without chalk.

My students also hated theSo what? question.

They complained to me, but their conclusions improved.

So here is one question, one irritating question, for critical thinking for sharing on one slide:

So what?


Testing a Thousand Madelyns

February 25, 2015 — 1 Comment

My niece is a beautiful little girl. She is a beautiful girl on the outside, the kind of little girl who cannot take a bad picture. She is also beautiful on the inside. She is her mother’s helper, fiercely loyal to her older brothers, and a wonderful example for her younger brother and sisters. She is the gracious hostess who makes sure you get the nicest decorated cupcake at the birthday party. She has an infectious laugh, a compassionate heart, and an amazing ability “to accessorize” her outfits. For the sake of her privacy, let’s call her Madelyn.

Two years ago, the teachers at her school, like teachers in thousands of elementary schools across the United States, prepared Madelyn and her siblings for the mandated state tests. There were regular notices sent home throughout the school year that discussed the importance of these tests. There was a “pep-test-rally” a week before the test where students made paper dolls which they decorated with their names. A great deal of time was spent getting students enthused about taking the tests.

Paper dollSeveral months later, Madelyn received her score on her 4th grade state test. She was handed her paper doll cut-out with her score laminated in big numbers across the paper doll she had made.

Madelyn was devastated.

She hated her score because she understood that her score was too low. She hid the paper doll throughout the day, and when she came home, she cried. She could not hang the paper doll on the refrigerator where her brother’s and sister’s scores hung. The scores on their paper dolls were higher.

She cried to her mother, and her mother also cried. Her mother remembered that same hurt when she had not done well on tests in school either. As they sobbed together, Madelyn told her mother, “I’m not smart.”

Now, the annual testing season is starting again. This year, there will be other students like Madelyn who will experience the hype of preparation, who will undergo weeks of struggling with tests, and then endure a form of humiliation when the results return. The administrators and teachers pressured to increase proficiency results on a state test, often forget the damage done to the students who do not achieve a high standard.

That paper doll created during the fervor of test preparation is an example of an unintended consequence; no one in charge considered how easily scores could be compared once they were available to students in so public a manner. Likewise, many stakeholders are unaware that the rallies, ice-cream parties, and award ceremonies do little to comfort those students who, for one reason or another, do not test well.

There is little consolation to offer 10-year-old students who see the results of state tests as the determiner of being “smart” because 10-year-old students believe tests are a final authority. 10-year-old students do not grasp the principles of test design that award total success to a few at the high end, and assign failure to a few at the low end, a design best represented by the bell curve, “the graphic representation showing the relative performance of individuals as measured against each other.” 10-year-old students do not understand that their 4th grade test scores are not indicators for later success.

Despite all the advances in computer adaptive testing using algorithms of one sort or another, today’s standardized tests are limited to evaluating a specific skill set; true performance based tests have not yet been developed because they are too costly and too difficult to standardized.

My niece Madelyn would excel in a true performance based task at any grade level, especially if the task involved her talents of collaboration, cooperation, and presentation. She would be recognized for the skill sets that are highly prized in today’s society: her work ethic, her creativity, her ability to communicate effectively, and her sense of empathy for others. If there were assessments and tests that addressed these particular talents, her paper doll would not bear the Scarlet Letter-like branding of a number she was ashamed to show to those who love her.

Furthermore, there are students who, unlike my niece Madelyn, do not have support from home. How these students cope with a disappointing score on a standardized test without support is unimaginable. Madelyn is fortunate to have a mother and father along with a network of people who see her all her qualities in total; she is prized more than test grades.

At the conclusion of that difficult school year, in a moment of unexpected honesty, Madelyn’s teacher pulled my sister aside.
“I wanted to speak to you, because I didn’t want you to be upset about the test scores,” he admitted to her. He continued, “I want you to know that if I could choose a student to be in my classes, I would take Madelyn…I would take a thousand Madelyns.”

It’s testing season again for a thousand Madelyns.
Each one should not be defined by a test score.

Graphic by Christopher King that accompanied the editorial piece "In Defense of Annual Testing"

Graphic by Christopher King that accompanied the editorial piece “In Defense of Annual Testing”

My Saturday morning coffee was disrupted by the headline in the New York Times opinion piece, In Defense of Annual School Testing  (2/7/15) by Chad Aldeman, an associate partner at Bellwether Education Partners, a nonprofit education research and consulting firm. Agitating me more than the caffeine in the coffee was clicking on Aldeman’s resume. Here was another a policy analyst in education, without any classroom experience, who served as an adviser to the Department of Education from 2011 to 2012. Here was another policy wonk with connections to the testing industry.

In a piece measuring less than 800 words, Aldeman contended that the “idea of less testing” in our nation’s schools, currently considered by liberals and conservative groups alike, “would actually roll back progress for America’s students.”

…annual testing has tremendous value. It lets schools follow students’ progress closely, and it allows for measurement of how much students learn and grow over time, not just where they are in a single moment.

Here is the voice of someone who has not seen students take a standardized test when, yes, they are very much in “that single moment.” That “single moment” looks different for each student. An annual test does not consider the social and emotional baggage of that “single moment” (EX: no dinner the night before; using social media or video game until 1 AM; parent separation or divorce; fight with friend, with mother, with teacher; or general text anxiety). Educators recognize that students are not always operating at optimum levels on test days. No student likes being tested at any “single moment.”

Aldeman’s editorial advocates for annual testing because he claims it prevents the kinds of tests that take a grade average results from a school. Taking a group average from a test, he notes, allows “the high performers frequently [to] mask what’s happening to low achievers.” He prefers the kinds of new tests that focus on groups of students with a level of analysis possible only with year to year measurement. That year to year is measurement on these expensive new tests is, no doubt, preferred by testing companies as a steady source of income.

His opinion piece comes at a time where the anti-test movement is growing and states are looking at the expenses of such tests. There is bipartisan agreement in the anti-test movement that states students are already being assessed enough. There are suggestions that annual testing could be limited to at specific grade levels, such as grades 3, 8, and 11, and that there are already enough assessments built into each student’s school day.

Educators engage in ongoing formative assessments (discussions, polls, homework, graphic organizers, exit slips, etc) used to inform instruction. Interim and summative assessments (quizzes/test) are used continuously to measure student performance. These multiple kinds of assessments provide teachers the feedback to measure student understanding and to differentiate instruction for all levels of students.

For example, when a teacher uses a reading running record assessment, the data collected can help determine what instruction will improve a child’s reading competency. When a teacher analyzes a math problem with a child, the teacher can assess which computational skills need to be developed or reviewed.

Furthermore, there are important measures that cannot be done by a standardized test.  Engaging students in conversations may provide insight into the  social or emotional issues that may be preventing that child’s academic performance.

Of course, the annual tests that Aldeman suggests need to be used to gain information on performance do not take up as much instructor time as the ongoing individual assessments given daily in classrooms. Testing does use manpower efficiently; one hour of testing can yield 30 student hours of results, and a teacher need not be present to administer a standardized test. Testing can diagnose each student strengths and/or weaknesses at that “single moment” in multiple areas at the same time. But testing alone cannot improve instruction, and improving instruction is what improves student performance.

In a perverse twist in logic, the allocation of funds and class time to pay for these annual tests results in a reduction of funds available to finance teachers and the number of instructional hours to improve and deliver the kind of instruction that the tests recommend. Aldeman notes that the Obama administration has invested $360 million in testing, which illustrates their choice in allocating funds to support a testing industry, not schools. The high cost of developing tests and collecting the test data results in stripping funds from state and local education budgets, and limits the financial resources for improving the academic achievement for students, many of those who Aldeman claims have “fallen through the cracks.”

His argument to continue annual testing does not refer to the obscene growth in the industry of testing, 57% in the past three years up to $2.5 billion, according to the Software & Information Industry Association. Testing now consumes the resources of every school district in the nation.

Aldeman concludes that annual testing should not be politicized, and that this time is “exactly the wrong time to accept political solutions leaving too many of our most vulnerable children hidden from view.”

I would counter that our most vulnerable children are not hidden from view by their teachers and their school districts. Sadly their needs cannot be placed “in focus” when the financial resources are reduced or even eliminated in order to fund this national obsession with testing. Aldeman’s defense is indefensible.

Since I write to understand what I think, I have decided to focus this particular post on the different categories of assessments. My thinking has been motivated by helping teachers with ongoing education reforms that have increased demands to measure student performance in the classroom. I recently organized a survey asking teachers about a variety of assessments: formative, interim, and summative. In determining which is which, I have witnessed their assessment separation anxieties.

Therefore, I am using this “spectrum of assessment” graphic to help explain:

Screenshot 2014-06-20 14.58.50

The “bands” between formative and interim assessments and the “bands” between interim and summative blur in measuring student progress.

At one end of the grading spectrum (right) lie the high stakes summative assessments that given at the conclusion of a unit, quarter or semester. In a survey given to teachers in my school this past spring,100 % of teachers understood these assessments to be the final measure of student progress, and the list of examples was much more uniform:

  • a comprehensive test
  • a final project
  • a paper
  • a recital/performance

At the other end, lie the low-stakes formative assessments (left) that provide feedback to the teacher to inform instruction. Formative assessments are timely, allowing teachers to modify lessons as they teach. Formative assessments may not be graded, but if they are, they do not contribute many points towards a student’s GPA.

In our survey, 60 % of teachers generally understood formative assessments to be those small assessments or “checks for understanding” that let them move on through a lesson or unit. In developing a list of examples, teachers suggested a wide range of examples of formative assessments they used in their daily practice in multiple disciplines including:

  • draw a concept map
  • determining prior knowledge (K-W-L)
  • pre-test
  • student proposal of project or paper for early feedback
  • homework
  • entrance/exit slips
  • discussion/group work peer ratings
  • behavior rating with rubric
  • task completion
  • notebook checks
  • tweet a response
  • comment on a blog

But there was anxiety in trying to disaggregate the variety of formative assessments from other assessments in the multiple colored band in the middle of the grading spectrum, the area given to interim assessments. This school year, the term interim assessments is new, and its introduction has caused the most confusion with members of my faculty. In the survey, teachers were first provided a definition:

An interim assessment is a form of assessment that educators use to (1) evaluate where students are in their learning progress and (2) determine whether they are on track to performing well on future assessments, such as standardized tests or end-of-course exams. (Ed Glossary)

Yet, one teacher responding to this definition on the survey noted, “sounds an awful lot like formative.” Others added small comments in response to the question, “Interim assessments do what?”

  • Interim assessments occur at key points during the marking period.
  • Interim assessment measure when a teacher moves to the next step in the learning sequence
  • interim assessments are worth less than a summative assessment.
  • Interim assessments are given after a major concept or skill has been taught and practiced.

Many teachers also noted how interim assessments should be used to measure student progress on standards such as those in the Common Core State Standards (CCSS) or standardized tests. Since our State of Connecticut is a member of the Smarter Balanced Assessment Consortium (SBAC), nearly all teachers placed practice for this assessment clearly in the interim band.

But finding a list of generic or even discipline specific examples of other interim assessments has proved more elusive. Furthermore, many teachers questioned how many interim assessments were necessary to measure student understanding? While there are multiple formative assessments contrasted with a minimal number of summative assessments, there is little guidance on the frequency of interim assessments.  So there was no surprise when 25% of our faculty still was confused in developing the following list of examples of interim assessments:

  • content or skill based quizzes
  • mid-tests or partial tests
  • SBAC practice assessments
  • Common or benchmark assessments for the CCSS

Most teachers believed that the examples blurred on the spectrum of assessment, from formative to interim and from interim to summative. A summative assessment that went horribly wrong could be repurposed as an interim assessment or a formative assessment that was particularly successful could move up to be an interim assessment. We agreed that the outcome or the results was what determined how the assessment could be used.

Part of teacher consternation was the result of assigning category weights for each assessment so that there would be a common grading procedure using common language for all stakeholders: students, teachers, administrators, and parents. Ultimately the recommendation was to set category weights to 30% summative, 10% formative, and 60% interim in the Powerschool grade book for next year.

In organizing the discussion, and this post, I did come across several explanations on the rational or “why” for separating out interim assessments. Educator Rick DuFour emphasized how the interim assessment responds to the question, “What will we do when some of them [students] don’t learn it [content]?” He argues that the data gained from interim assessments can help a teacher prevent failure in a summative assessment given later.Screenshot 2014-06-20 16.50.15

Another helpful explanation came from a 2007 study titled “The Role of Interim Assessments in a Comprehensive Assessment System,” by the National Center for the Improvement of Educational Assessment and the Aspen Institute. This study suggested that three reasons to use interim assessments were: for instruction, for evaluation, and for prediction. They did not use a color spectrum as a graphic, but chose instead a right triangle to indicate the frequency of the interim assessment for instructing, evaluating and predicting student understanding.

I also predict that our teachers will become more comfortable with separating out the interim assessments as a means to measure student progress once they see them as part of a large continuum that can, on occasion,  be a little fuzzy. Like the bands on a color spectrum, the separation of assessments may blur, but they are all necessary to give the complete (and colorful) picture of student progress.

At the intersection of data and evaluation, here is a hypothetical scenario:Screenshot 2014-06-08 20.56.29

A young teacher meets an evaluator for a mid-year meeting.

“85 % of the students are meeting the goal of 50% or better, in fact they just scored an average of 62.5%,” the young teacher says.

“That is impressive,” the evaluator responds noting that the teacher had obviously met his goal. “Perhaps,you could also explain how the data illustrates individual student performance and not just the class average?”

“Well,” says the teacher offering a printout, “according to the (Blank) test, this student went up 741 points, and this student went up….” he continues to read from the  spreadsheet, “81points…and this student went up, um, 431 points, and…”

“So,” replies the evaluator, “these points mean what? Grade levels? Stanine? Standard score?”

“I’m not sure,” says the young teacher, looking a bit embarrassed, “I mean, I know my students have improved, they are moving up, and they are now at a 62.5% average, but…” he pauses.

“You don’t know what these points mean,” answers the evaluator, “why not?”

This teacher who tracked an upward trajectory of points was able to illustrate a trend that his students are improving, but the numbers or points his students receive are meaningless without data analysis. What doesn’t he know?

“We just were told to do the test. No one has explained anything…yet,” he admits.

There will need to be time for a great deal of explaining as the new standardized tests, Smarter Balanced Assessments (SBAC) and the Partnership for Assessment of Readiness for College and Careers (PARCC), that measure the Common Core State Standards (CCSS) are implemented over the next few years. These digital tests are part of an educational reform mandate that will require teachers at every grade level to become adept at interpreting data for use in instruction. This interpretation will require dedicated professional development at every grade level.

Understanding how to interpret data from these new standardized tests and others must be part of every teacher’s professional development plan. Understanding a test’s metrics is critical because there exists the possibility of misinterpreting results.  For example, the data in the above scenario would appear that one student (+741 points) is making enormous leaps forward while another student (+81) is lagging behind. But suppose how different the data analysis would be if the scale of measuring student performance on this particular test was organized in levels of 500 point increments. In that circumstance, one student’s improvement of +741 may not seem so impressive and a student achieving +431 may be falling short of moving up a level. Or perhaps, the data might reveal that a student’s improvement of 81 points is not minimal, because that student had already maxed out towards the top of the scale. In the drive to improve student performance, all teachers must have a clear understanding of how the results are measured, what skills are tested, and how can this information can be used to drive instruction.

Therefore, professional development must include information on the metrics for how student performance will be measured for each different test. But professional development for data analysis cannot stop at the powerpoint!   Data analysis training cannot come “canned,” especially, if the professional development is marketed by a testing company. Too often teachers are given information about testing metrics by those outside the classroom with little opportunity to see how the data can help their practice in their individual classrooms. Professional development must include the conversations and collaborations that allow teachers to share how they could use or do use data in the classroom. Such conversations and collaborations with other teachers will provide opportunities for teachers to review these test results to support or contradict data from other assessments.

Such conversations and collaborations will also allow teachers to revise lessons or units and update curriculum to address weakness exposed by data from a variety of assessments. Interpreting data must be an ongoing collective practice for teachers at every grade level; teacher competency with data will come with familiarity.

In addition, the collection of data should be on a software platform that is accessible and integrated with other school assessment programs. The collection of data must be both transparent in the collection of results and secure in protecting the privacy of each student. The benefit of technology is that digital testing platforms should be able to calculate results in a timely manner in order to free up the time teachers can have to implement changes suggested because of data analysis. Most importantly, teachers should be trained how to use this software platform.

Student data is a critical in evaluating both teacher performance and curriculum effectiveness, and teachers must be trained how to interpret rich pool of data that is coming from new standardized tests. Without the professional development steps detailed above, however, evaluation conversations in the future might sound like the response in the opening scenario:

“We just were told to do the test. No one has explained anything…yet.”

Screenshot 2014-05-31 14.25.03As the school year comes to a close, the buzzphrase is “student growth.” All stakeholders in education want to be able to demonstrate student growth, especially if student growth could be on an upwards trajectory like the graph at left.

Last week I had an opportunity to consider student growth with a different lens, and that lens was provided by a graduating senior who was preparing a presentation to a group of 7th & 8th graders.
I had assigned Steven and his classmates the task of developing  TED-like-Talks that they would give to the middle schoolers. The theme of these talks was “The Most Important Lesson I Learned in 13 Years of Education.” The talk was required  to be short (3-5 minutes), to incorporate graphics, and to make a connection between what was learned and the outside world. I asked students to come up some “profound” idea that made the lesson the most important lesson in their academic career. I gave them several periods to pitch ideas and practice.

Steven’s practice presentation was four slides long on the lesson “Phase Changes of Water.” There was a graphic on each slide that illustrated the changes of water from solid ice to liquid to vapor. The last slide illustrated the temperatures at which water underwent a change and the amount of heat energy or calories expended to make that phase change (below):

phaseplot

“What you see in this graph,” Steven explained, “is that there is a stage, a critical point, where the amount of energy needs to increase to have water change from solid to liquid. The graph shows that stage of changing from solid to liquid is shorter than the stage where the amount of energy needs to increase to change water into steam.”
He pointed to the lines on the graph, first the shorter line labeled melting and then longer line labeled vaporizing.
“So how is this a profound idea?” he asked. “Well, this chart is just like anything you might want to improve on. Sometimes you are working to go to the next level, but you hit a plateau, a critical point. You need to expend more energy for a longer period of time to get to that next level. Thank you.”

We clapped. Everyone sitting in class agreed that Steven had met the assignment. He met the time limit. He had graphics. He made a connection.
I saw something even more profound.

In less than three minutes, Steven had used what he had learned in physics to teach me a new way to consider the learning process. I could see phase changes or phase transitions to illustrate the relationship between energy expended over time and academic performance. I could relabel the side marked heat energy to a label of “energy expended over time.”  Some phase changes would be short, as in the change from ice to a liquid state. Other phase changes would be longer, as in the change from liquid to gas. Each line of phase change would be different.

For example, if I applied this idea to teaching  English grammar, some student phase changes would be short, as in a student’s use of pronouns to represent a noun. Other phase changes could be much longer, such as that same student employing noun-pronoun agreement. Time and energy would need to be expended to improve individual student performance on this task.

But whose energy is measured in this re-imagined transition? Perhaps the idea of phase changes could be used to explain how a teacher’s energy expended in instruction over time, or during a critical point, could improve academic performance. The same idea could be used to demonstrate how a student must expend additional energy at a critical point to improve understanding in order to advance to the next level.

At the end of the school year, teachers need to provide evidence of individual student growth, but perhaps a student is in a transitioning phase and growth is not yet evident?  The major variable in measuring student achievement is the length of the critical point of transition from one level to another, and that length of that critical point could extend for the length of a school year or maybe even longer. Growth may not be measured in the time provided and more energy may need to be expended.

What was so interesting to me was how Steven’s use of phase changes had given me another lens to view the students I assess and the teachers I evaluate. Because measuring academic progress is not fixed by the same physical laws where 540 calories are needed to turn 1 gram (at 100 degrees Celsius) of water to steam, each student’s graph of academic achievement (phase changes) varies. Critical points will be at different levels of achievement measured by different lengths of energy expended. Despite the wishes of teachers, administrators, and students themselves, “growth” is rarely on that 45º trajectory. Instead, growth is represented by moving up a series of stages or critical points that illustrate the amount of energy, by student and/or teacher, spent over time.

Energy matters, in physics and in student achievement. Steven’s TEDTalk gave me a new way to think about that. He was profound. I think he gets an A.

capt As the 10th grade English teacher, Linda’s role had been to prepare students for the rigors of the State of Connecticut Academic Performance Test, otherwise known as the CAPT. She had been preparing students with exam-released materials, and her collection of writing prompts stretched back to 1994.  Now that she will be retiring, it is time to clean out the classroom. English teachers are not necessarily hoarders, but there was evidence to suggest that Linda was stocked with enough class sets of short stories to ensure  students were always more than adequately prepared. Yet, she was delighted to see these particular stories go.
“Let’s de-CAPT-itate,” we laughed and piled up the cartons containing well-worn copies of short stories.
Out went Rough Touch. Out went Machine Runner. Out went Farewell to Violet, and a View from the Bridge.
I chuckled at the contents of the box labelled”depressing stories” before chucking them onto the pile.
Goodbye to Amanda and the Wounded Birds. Farewell to A Hundred Bucks of Happy. Adios to Catch the Moon. We pulled down another carton labeled  “dog stories” containing LibertyViva New JerseyThe Dog Formally Known as Victor Maximilian Bonaparte Lincoln Rothbaum. They too were discarded without a tear.
The CAPT’s Response to Literature’s chief flaw was the ludicrous diluting of Louise Rosenblatt’s Reader Response Theory where students were asked to “make a connection:”

What does the story say about people in general?  In what ways does it remind you of people you have known or experiences you have had?  You may also write about stories or other books you have read, or movies, works of art, or television programs you have seen.

That question was difficult for many of the literal readers, who, in responding to the most obvious plot point, might answer, “This story has a dog and I have a dog.” How else to explain all the dog stories? On other occasions, I found out that while taking standardized test in the elementary grades students had been told, “if you have no connection to the story, make one up!” Over the years, the CAPT turned our students into very creative liars rather than literary analysts.


The other flaw in the Response to Literature  was the evaluation question. Students were asked,  

How successful was the author in creating a good piece of literature?  Use examples from the story to explain your thinking.

Many of our students found this a difficult question to negotiate, particularly if they thought the author did not write a good piece of literature, but rather an average or mildly enjoyable story. They did manage to make their opinions known, and  one of my favorite student responses began, “While this story is no  Macbeth, there are a few nice metaphors…”

Most of the literature on the CAPT did come from reputable writers, but they were not the quality stories found in anthologies like Saki’s The Interlopers or Anton Chekhov’s The Bet. To be honest, I did not think the CAPT essays were an authentic activity, and I particularly did not like the selections on the CAPT’s Response to Literature section.

Now the CAPT will be replaced by the Smarter Balanced Assessments (SBAC), as Connecticut has selected SBAC as their assessment consortium to measure progress with the Common Core State Standards, and the test will move to 11th grade. This year (2014) is the pilot test only; there are no exemplars and no results.  The SBAC is digital, and in the future we will practice taking this test on our devices, so there is no need to hang onto class sets of short stories. So why am I concerned that there will be no real difference with the SBAC? Cleaning the classroom may be a transition that is more symbolic of our move from paper to keyboard than in our gaining an authentic assessment.

Nevertheless, Linda’s classroom looked several tons lighter.

“We are finally de-CAPT-itated!” I announced looking at the stack of boxes ready for the dumpster.

“Just in time to be SBAC-kled!” Linda responded cheerfully.

Screen Shot 2014-04-06 at 11.16.51 AMNot so long ago, 11th grade was a great year of high school. The pre-adolescent fog had lifted, and the label of “sophomore,” literally “wise-fool,” gave way to the less insulting “junior.” Academic challenges and social opportunities for 16 and 17 years olds increased as students sought driver’s permits/licenses, employment or internships in an area of interest. Students in this stage of late adolescence could express interest in their future plans, be it school or work.

Yet, the downside to junior year had always been college entrance exams, and so, junior year had typically been spent in preparation for the SAT or ACT. When to take these exams had always been up to the student who paid a base price $51/SAT or $36.50/ACT for the privilege of spending hours testing in a supervised room and weeks in anguish waiting for the results. Because a college accepts the best score, some students could choose to take the test many times as scores generally improve with repetition.

Beginning in 2015, however, junior students must prepare for another exam in order to measure their learning using the Common Core State Standards (CCSS). The two federally funded testing consortiums, Smarter Balanced Assessments (SBAC) or the Partnership for Assessment of Readiness for College and Careers (PARCC) have selected 11th grade to determine the how college and career ready a student is in English/Language Arts and Math.

The result of this choice is that 11th grade students will be taking the traditional college entrance exam (SAT or ACT) on their own as an indicator of their college preparedness. In addition, they will take another state-mandated exam, either the SBAC or the PARRC, that also measures their college and career readiness. While the SAT or ACT is voluntary, the SBAC or PARRC will be administered during the school day, using 8.5 hours of instructional time.

Adding to these series of tests lined up for junior year are the Advanced Placement exams. There are many 11th grade students who opt to take Advanced Placement courses in a variety of disciplines either to gain college credit for a course or to indicate to college application officers an academic interest in college level material. These exams are also administered during the school day during the first weeks of May, each taking 4 hours to complete.

One more possible test to add to this list might be the Armed Services Vocational Aptitude Battery (ASVAB test) which, according to the website Today’s Military,  is given to more than half of all high schools nationwide to students in grade 10th, 11th or 12th, although 10th graders cannot use their scores for enlistment eligibility.

The end result is that junior year has gradually become the year of testing, especially from the months of March through June, and all this testing is cutting into valuable instructional time. When students enter 11th grade, they have completed many pre-requisites for more advanced academic classes, and they can tailor their academic program with electives, should electives be offered. For example, a student’s success with required courses in math and science can inform his or her choices in economics, accounting, pre-calculus, Algebra II, chemistry, physics, or Anatomy and Physiology. Junior year has traditionally been a student’s greatest opportunity to improve a GPA before making college applications, so time spent learning is valuable. In contrast, time spent in mandated testing robs each student of classroom instruction time in content areas.

In taking academic time to schedule exams, schools can select their exam (2 concurrent) weeks for performance and non-performance task testing.  The twelve week period (excluding blackout dates) from March through June is the nationwide current target for the SBAC exams, and schools that choose an “early window” (March-April) will lose instructional time before the Advanced Placement exams which are given in May. Mixed (grades 11th & 12th) Advanced Placement classes will be impacted during scheduled SBACs as well because teachers can only review past materials instead of progressing with new topics in a content area. Given these circumstances, what district would ever choose an early testing window?  Most schools should opt for the “later window” (May) in order to allow 11th grade AP students to take the college credit exam before having to take (another) exam that determines their college and career readiness. Ironically, the barrage of tests that juniors must now complete to determine their “college and career readiness” is leaving them with less and less academic time to become college and career ready.

Perhaps the only fun remaining for 11th graders is the tradition of the junior prom. Except proms are usually held between late April and early June, when -you guessed it- there could be testing.