Archives For SBAC

Notice how I am trying to beat the character limit on headlines?

Here’s the translation:

For your information, Juniors: Connecticut’s Common Core State Standards Smarter Balanced Assessment [Consortium] is Dead on Arrival; Insert Scholastic Achievement Test

Yes, in the State of Connecticut, the test created through the Smarter Balanced Assessment Consortium (SBAC) based on the Common Core State Standards will be canceled for juniors (11th graders) this coming school year (2015-16) and replaced by the Scholastic Achievement Test  (SAT).

The first reaction from members of the junior class should be an enormous sigh of relief. There will be one less set of tests to take during the school year. The second sigh will come from other students, faculty members, and the administrative team for two major reasons-the computer labs will now be available year round and schedules will not have to be rearranged for testing sessions.

SAT vs. SBAC Brand

In addition, the credibility of the SAT will most likely receive more buy-in from all stakeholders. Students know what the brand SAT is and what the scores mean; students are already invested in doing well for college applications. Even the shift from the old score of 1600 (pre-2005) to 2400  with the addition of an essay has been met with general understanding that a top score is  800 in each section (math, English, or essay). A student’s SAT scores are part of a college application, and a student may take the SAT repeatedly in order to submit the highest score.

In contrast, the SBAC brand never reported student individual results. The SABC was created as an assessment for collecting data for teacher and/or curriculum evaluation. When the predictions of the percentage of anticipated failures in math and English were released, there was frustration for teachers and additional disinterest by students. There was no ability to retake, and if predictions meant no one could pass, why should students even try?

Digital TestingScantron

Moreover, while the SBAC drove the adoption of digital testing in the state in grades 3-8, most of the pre-test skill development was still given in pen and pencil format. Unless the school district consistently offered a seamless integration of 1:1 technology, there could be question as to what was being assessed-a student’s technical skills or application of background knowledge. Simply put, skills developed with pen and pencils may not translate the same on digital testing platforms.

As a side note, those who use computer labs or develop student schedules will be happy to know that SAT is not a digital test….at least not yet.

US Education Department Approved Request 

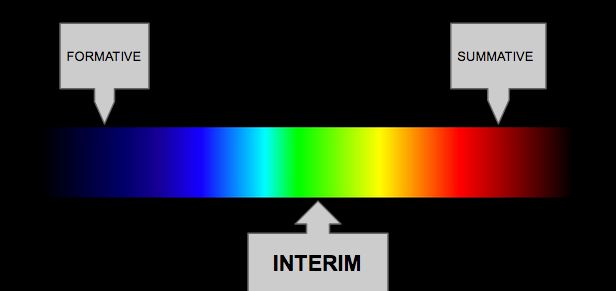
According to an early report (2006) by The Brooking’s Institute, the SBAC’s full suite of summative and interim assessments and the Digital Library on formative assessment was first estimated to cost $27.30 per student (grades 3-11). The design of the assessment would made economical if many states shared the same test.

Since that intial report, several states have left the Smarter Balanced Consortium entirely.

In May, the CT legislature voted to halt SBAC in grade ii in favor of the SAT. This switch will increase the cost of testing.According to an article (5/28/15) in the CT Mirror “Debate Swap the SAT for the Smarter Balanced Tests” :

“‘Testing students this year and last cost Connecticut $17 million’, the education department reports. ‘And switching tests will add cost,’ Commissioner of Education Dianna Wentzell said.”

This switch was approved by the U.S. Department of Education for Connecticut schools Thursday, 8/6/15, the CT Department of Education had asked it would not be penalized under the No Child Left Behind Act’s rigid requirements. Currently the switch for the SAT would not change the tests in grades 3-8; SBAC would continue at these grade levels.

Why SBAC at All?

All this begs the question, why was 11th grade selected for the SBAC in the first place? Was the initial cost a factor?

Since the 1990s, the  State of Connecticut had given the Connecticut Achievement Performance Test (CAPT) in grade 10, and even though the results were reported late, there were still two years to remediate students who needed to develop skills. In contrast, the SBAC was given the last quarter of grade 11, leaving less time to address any low level student needs. I mentioned these concerns in an earlier post: The Once Great Junior Year, Ruined by Testing.

Moving the SBAC to junior year increased the amount of testing for those electing to take the SAT with some students taking the ASVAB (Armed Services Vocational Aptitude Battery) or selected to take the NAEP (The National Assessment of Educational Progress).

There have been three years of “trial testing” for the SBAC in CT and there has been limited feedback to teachers and students. In contrast, the results from the SAT have always been available as an assessment to track student progress, with results reported to the school guidance departments.

Before No Child Left Behind, before the Common Core State Standards, before SBAC, the SAT was there. What took so them (legislature, Department of Education, etc) so long?

Every Junior Will Take the NEW SAT
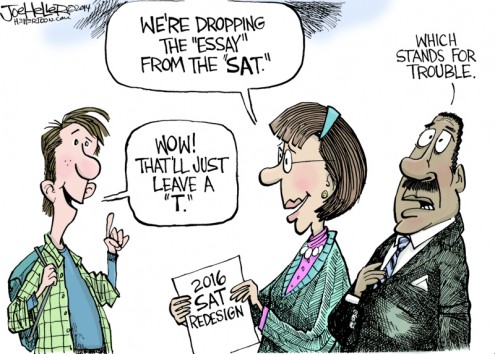
Denver Post: Heller

Denver Post: Heller

In the past, not every student elected to take the SAT test, but many districts did offer the PSAT as an incentive. This coming year, the SAT will be given to every 11th grader in Connecticut.

The big wrinkle in this plan?
The SAT test has been revised (again) and will be new in March 2016.

What should we expect with this test?

My next headline?

OMG. HWGA.

Since I write to understand what I think, I have decided to focus this particular post on the different categories of assessments. My thinking has been motivated by helping teachers with ongoing education reforms that have increased demands to measure student performance in the classroom. I recently organized a survey asking teachers about a variety of assessments: formative, interim, and summative. In determining which is which, I have witnessed their assessment separation anxieties.

Therefore, I am using this “spectrum of assessment” graphic to help explain:

Screenshot 2014-06-20 14.58.50

The “bands” between formative and interim assessments and the “bands” between interim and summative blur in measuring student progress.

At one end of the grading spectrum (right) lie the high stakes summative assessments that given at the conclusion of a unit, quarter or semester. In a survey given to teachers in my school this past spring,100 % of teachers understood these assessments to be the final measure of student progress, and the list of examples was much more uniform:

  • a comprehensive test
  • a final project
  • a paper
  • a recital/performance

At the other end, lie the low-stakes formative assessments (left) that provide feedback to the teacher to inform instruction. Formative assessments are timely, allowing teachers to modify lessons as they teach. Formative assessments may not be graded, but if they are, they do not contribute many points towards a student’s GPA.

In our survey, 60 % of teachers generally understood formative assessments to be those small assessments or “checks for understanding” that let them move on through a lesson or unit. In developing a list of examples, teachers suggested a wide range of examples of formative assessments they used in their daily practice in multiple disciplines including:

  • draw a concept map
  • determining prior knowledge (K-W-L)
  • pre-test
  • student proposal of project or paper for early feedback
  • homework
  • entrance/exit slips
  • discussion/group work peer ratings
  • behavior rating with rubric
  • task completion
  • notebook checks
  • tweet a response
  • comment on a blog

But there was anxiety in trying to disaggregate the variety of formative assessments from other assessments in the multiple colored band in the middle of the grading spectrum, the area given to interim assessments. This school year, the term interim assessments is new, and its introduction has caused the most confusion with members of my faculty. In the survey, teachers were first provided a definition:

An interim assessment is a form of assessment that educators use to (1) evaluate where students are in their learning progress and (2) determine whether they are on track to performing well on future assessments, such as standardized tests or end-of-course exams. (Ed Glossary)

Yet, one teacher responding to this definition on the survey noted, “sounds an awful lot like formative.” Others added small comments in response to the question, “Interim assessments do what?”

  • Interim assessments occur at key points during the marking period.
  • Interim assessment measure when a teacher moves to the next step in the learning sequence
  • interim assessments are worth less than a summative assessment.
  • Interim assessments are given after a major concept or skill has been taught and practiced.

Many teachers also noted how interim assessments should be used to measure student progress on standards such as those in the Common Core State Standards (CCSS) or standardized tests. Since our State of Connecticut is a member of the Smarter Balanced Assessment Consortium (SBAC), nearly all teachers placed practice for this assessment clearly in the interim band.

But finding a list of generic or even discipline specific examples of other interim assessments has proved more elusive. Furthermore, many teachers questioned how many interim assessments were necessary to measure student understanding? While there are multiple formative assessments contrasted with a minimal number of summative assessments, there is little guidance on the frequency of interim assessments.  So there was no surprise when 25% of our faculty still was confused in developing the following list of examples of interim assessments:

  • content or skill based quizzes
  • mid-tests or partial tests
  • SBAC practice assessments
  • Common or benchmark assessments for the CCSS

Most teachers believed that the examples blurred on the spectrum of assessment, from formative to interim and from interim to summative. A summative assessment that went horribly wrong could be repurposed as an interim assessment or a formative assessment that was particularly successful could move up to be an interim assessment. We agreed that the outcome or the results was what determined how the assessment could be used.

Part of teacher consternation was the result of assigning category weights for each assessment so that there would be a common grading procedure using common language for all stakeholders: students, teachers, administrators, and parents. Ultimately the recommendation was to set category weights to 30% summative, 10% formative, and 60% interim in the Powerschool grade book for next year.

In organizing the discussion, and this post, I did come across several explanations on the rational or “why” for separating out interim assessments. Educator Rick DuFour emphasized how the interim assessment responds to the question, “What will we do when some of them [students] don’t learn it [content]?” He argues that the data gained from interim assessments can help a teacher prevent failure in a summative assessment given later.Screenshot 2014-06-20 16.50.15

Another helpful explanation came from a 2007 study titled “The Role of Interim Assessments in a Comprehensive Assessment System,” by the National Center for the Improvement of Educational Assessment and the Aspen Institute. This study suggested that three reasons to use interim assessments were: for instruction, for evaluation, and for prediction. They did not use a color spectrum as a graphic, but chose instead a right triangle to indicate the frequency of the interim assessment for instructing, evaluating and predicting student understanding.

I also predict that our teachers will become more comfortable with separating out the interim assessments as a means to measure student progress once they see them as part of a large continuum that can, on occasion,  be a little fuzzy. Like the bands on a color spectrum, the separation of assessments may blur, but they are all necessary to give the complete (and colorful) picture of student progress.

At the intersection of data and evaluation, here is a hypothetical scenario:Screenshot 2014-06-08 20.56.29

A young teacher meets an evaluator for a mid-year meeting.

“85 % of the students are meeting the goal of 50% or better, in fact they just scored an average of 62.5%,” the young teacher says.

“That is impressive,” the evaluator responds noting that the teacher had obviously met his goal. “Perhaps,you could also explain how the data illustrates individual student performance and not just the class average?”

“Well,” says the teacher offering a printout, “according to the (Blank) test, this student went up 741 points, and this student went up….” he continues to read from the  spreadsheet, “81points…and this student went up, um, 431 points, and…”

“So,” replies the evaluator, “these points mean what? Grade levels? Stanine? Standard score?”

“I’m not sure,” says the young teacher, looking a bit embarrassed, “I mean, I know my students have improved, they are moving up, and they are now at a 62.5% average, but…” he pauses.

“You don’t know what these points mean,” answers the evaluator, “why not?”

This teacher who tracked an upward trajectory of points was able to illustrate a trend that his students are improving, but the numbers or points his students receive are meaningless without data analysis. What doesn’t he know?

“We just were told to do the test. No one has explained anything…yet,” he admits.

There will need to be time for a great deal of explaining as the new standardized tests, Smarter Balanced Assessments (SBAC) and the Partnership for Assessment of Readiness for College and Careers (PARCC), that measure the Common Core State Standards (CCSS) are implemented over the next few years. These digital tests are part of an educational reform mandate that will require teachers at every grade level to become adept at interpreting data for use in instruction. This interpretation will require dedicated professional development at every grade level.

Understanding how to interpret data from these new standardized tests and others must be part of every teacher’s professional development plan. Understanding a test’s metrics is critical because there exists the possibility of misinterpreting results.  For example, the data in the above scenario would appear that one student (+741 points) is making enormous leaps forward while another student (+81) is lagging behind. But suppose how different the data analysis would be if the scale of measuring student performance on this particular test was organized in levels of 500 point increments. In that circumstance, one student’s improvement of +741 may not seem so impressive and a student achieving +431 may be falling short of moving up a level. Or perhaps, the data might reveal that a student’s improvement of 81 points is not minimal, because that student had already maxed out towards the top of the scale. In the drive to improve student performance, all teachers must have a clear understanding of how the results are measured, what skills are tested, and how can this information can be used to drive instruction.

Therefore, professional development must include information on the metrics for how student performance will be measured for each different test. But professional development for data analysis cannot stop at the powerpoint!   Data analysis training cannot come “canned,” especially, if the professional development is marketed by a testing company. Too often teachers are given information about testing metrics by those outside the classroom with little opportunity to see how the data can help their practice in their individual classrooms. Professional development must include the conversations and collaborations that allow teachers to share how they could use or do use data in the classroom. Such conversations and collaborations with other teachers will provide opportunities for teachers to review these test results to support or contradict data from other assessments.

Such conversations and collaborations will also allow teachers to revise lessons or units and update curriculum to address weakness exposed by data from a variety of assessments. Interpreting data must be an ongoing collective practice for teachers at every grade level; teacher competency with data will come with familiarity.

In addition, the collection of data should be on a software platform that is accessible and integrated with other school assessment programs. The collection of data must be both transparent in the collection of results and secure in protecting the privacy of each student. The benefit of technology is that digital testing platforms should be able to calculate results in a timely manner in order to free up the time teachers can have to implement changes suggested because of data analysis. Most importantly, teachers should be trained how to use this software platform.

Student data is a critical in evaluating both teacher performance and curriculum effectiveness, and teachers must be trained how to interpret rich pool of data that is coming from new standardized tests. Without the professional development steps detailed above, however, evaluation conversations in the future might sound like the response in the opening scenario:

“We just were told to do the test. No one has explained anything…yet.”

Screen Shot 2014-04-06 at 11.16.51 AMNot so long ago, 11th grade was a great year of high school. The pre-adolescent fog had lifted, and the label of “sophomore,” literally “wise-fool,” gave way to the less insulting “junior.” Academic challenges and social opportunities for 16 and 17 years olds increased as students sought driver’s permits/licenses, employment or internships in an area of interest. Students in this stage of late adolescence could express interest in their future plans, be it school or work.

Yet, the downside to junior year had always been college entrance exams, and so, junior year had typically been spent in preparation for the SAT or ACT. When to take these exams had always been up to the student who paid a base price $51/SAT or $36.50/ACT for the privilege of spending hours testing in a supervised room and weeks in anguish waiting for the results. Because a college accepts the best score, some students could choose to take the test many times as scores generally improve with repetition.

Beginning in 2015, however, junior students must prepare for another exam in order to measure their learning using the Common Core State Standards (CCSS). The two federally funded testing consortiums, Smarter Balanced Assessments (SBAC) or the Partnership for Assessment of Readiness for College and Careers (PARCC) have selected 11th grade to determine the how college and career ready a student is in English/Language Arts and Math.

The result of this choice is that 11th grade students will be taking the traditional college entrance exam (SAT or ACT) on their own as an indicator of their college preparedness. In addition, they will take another state-mandated exam, either the SBAC or the PARRC, that also measures their college and career readiness. While the SAT or ACT is voluntary, the SBAC or PARRC will be administered during the school day, using 8.5 hours of instructional time.

Adding to these series of tests lined up for junior year are the Advanced Placement exams. There are many 11th grade students who opt to take Advanced Placement courses in a variety of disciplines either to gain college credit for a course or to indicate to college application officers an academic interest in college level material. These exams are also administered during the school day during the first weeks of May, each taking 4 hours to complete.

One more possible test to add to this list might be the Armed Services Vocational Aptitude Battery (ASVAB test) which, according to the website Today’s Military,  is given to more than half of all high schools nationwide to students in grade 10th, 11th or 12th, although 10th graders cannot use their scores for enlistment eligibility.

The end result is that junior year has gradually become the year of testing, especially from the months of March through June, and all this testing is cutting into valuable instructional time. When students enter 11th grade, they have completed many pre-requisites for more advanced academic classes, and they can tailor their academic program with electives, should electives be offered. For example, a student’s success with required courses in math and science can inform his or her choices in economics, accounting, pre-calculus, Algebra II, chemistry, physics, or Anatomy and Physiology. Junior year has traditionally been a student’s greatest opportunity to improve a GPA before making college applications, so time spent learning is valuable. In contrast, time spent in mandated testing robs each student of classroom instruction time in content areas.

In taking academic time to schedule exams, schools can select their exam (2 concurrent) weeks for performance and non-performance task testing.  The twelve week period (excluding blackout dates) from March through June is the nationwide current target for the SBAC exams, and schools that choose an “early window” (March-April) will lose instructional time before the Advanced Placement exams which are given in May. Mixed (grades 11th & 12th) Advanced Placement classes will be impacted during scheduled SBACs as well because teachers can only review past materials instead of progressing with new topics in a content area. Given these circumstances, what district would ever choose an early testing window?  Most schools should opt for the “later window” (May) in order to allow 11th grade AP students to take the college credit exam before having to take (another) exam that determines their college and career readiness. Ironically, the barrage of tests that juniors must now complete to determine their “college and career readiness” is leaving them with less and less academic time to become college and career ready.

Perhaps the only fun remaining for 11th graders is the tradition of the junior prom. Except proms are usually held between late April and early June, when -you guessed it- there could be testing.

Opening speeches generally start with a “Welcome.”
Lucy Calkins started the 86th Saturday Reunion, March 22, 2014, at Teacher’s College with a conjunction.

“And this is the important thing” she addressed the crowd that was filling up the rows in the Riverside Cathedral, “the number of people who are attending has grown exponentially. This day is only possible with the goodwill of all.”

Grabbing the podium with both hands, and without waiting for the noise to die down, Calkins launched the day as if she was completing a thought she had from the last Saturday Reunion.

“We simply do not have the capacity to sign you up for workshops and check you in. We all have to be part of the solution.”

She was referring to the  workshops offered free of charge to educators by all Teachers College Reading and Writing Project (TCRWP) staff developers at Columbia University. This particular Saturday, there were over 125 workshops advertised on topic such as “argument writing, embedding historical fiction in nonfiction text sets, opinion writing for very young writers, managing workshop instruction, aligning instruction to the CCSS, using performance assessments and curriculum maps to ratchet up the level of teaching, state-of-the-art test prep, phonics, and guided reading.”

“First of all, ” she chided, “We cannot risk someone getting hit by a car.” Calkin’s concerns are an indication that the Saturday Reunion workshop program is a victim of its own success. The thousands of teachers disembarking from busses, cars, and taxis were directed by TCRWP minions to walk on sidewalks, wait at crosswalks, and “follow the balloons” to the Horace Mann building or Zankel Hall.

“Cross carefully,” she scolded in her teacher voice, “and be careful going into the sessions,” she continued, “the entrances to the larger workshops are the center doors, the exits are to the sides. We can’t have 800 people going in and out the same way.”

Safety talk over, Calkins turned her considerable energy to introducing a new collaborative venture, a website where educators can record their first hand experiences with the Common Core State Standards and Smarter Balanced Assessments (SBAC) or the Partnership for Assessment of Readiness for College and Careers (PARCC) testing.

And, as unbelievable as this sounds, Calkins admitted that, sometimes, “I get afraid to talk out.”
That is why, she explained, she has joined an all-star cast of educators (including Diane Ravitch, Kylene Beers, Grant Wiggins, Robert Marzano, Anthony Cody, Kathy Collins, Jay McTighe, David Pearson, Harvey “Smokey” Daniels and others-see below) in organizing a website where the voices of educators with first hand experience with standardized testing can document their experiences. The site is called Testing Talkhttp://testingtalk.org/) The site’s message on the home page states:

This site provides a space for you to share your observations of the new breed of standardized tests. What works? What doesn’t? Whether your district is piloting PARCC, Smarter Balanced, or its own test, we want to pass the microphone to you, the people closest to the students being tested. The world needs to hear your stories, insights, and suggestions. Our goal is collective accountability and responsiveness through a national, online conversation.

Screenshot 2014-03-31 21.56.01 Calkin’s promotion was directed to educators, “This will be a site for you to record your experience with testing, not to rant.” She noted that as schools “are spending billions, all feedback on testing should be open and transparent.” 

Winding down Calkins looked up from her notes. “You will all be engaged,” she promised. “Enter comments; sign your name,” she urged before closing with the final admonishment, “Be brave.”

Continue Reading…