
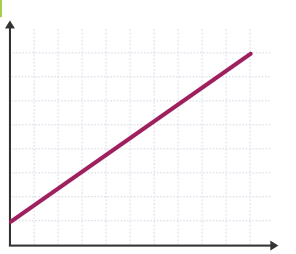
 As the school year comes to a close, the buzzphrase is “student growth.” All stakeholders in education want to be able to demonstrate student growth, especially if student growth could be on an upwards trajectory like the graph at left.
Last week I had an opportunity to consider student growth with a different lens, and that lens was provided by a graduating senior who was preparing a presentation to a group of 7th & 8th graders.
I had assigned Steven and his classmates the task of developing TED-like-Talks that they would give to the middle schoolers. The theme of these talks was “The Most Important Lesson I Learned in 13 Years of Education.” The talk was required to be short (3-5 minutes), to incorporate graphics, and to make a connection between what was learned and the outside world. I asked students to come up some “profound” idea that made the lesson the most important lesson in their academic career. I gave them several periods to pitch ideas and practice.
Steven’s practice presentation was four slides long on the lesson “Phase Changes of Water.” There was a graphic on each slide that illustrated the changes of water from solid ice to liquid to vapor. The last slide illustrated the temperatures at which water underwent a change and the amount of heat energy or calories expended to make that phase change (below):
“What you see in this graph,” Steven explained, “is that there is a stage, a critical point, where the amount of energy needs to increase to have water change from solid to liquid. The graph shows that stage of changing from solid to liquid is shorter than the stage where the amount of energy needs to increase to change water into steam.”
He pointed to the lines on the graph, first the shorter line labeled melting and then longer line labeled vaporizing.
“So how is this a profound idea?” he asked. “Well, this chart is just like anything you might want to improve on. Sometimes you are working to go to the next level, but you hit a plateau, a critical point. You need to expend more energy for a longer period of time to get to that next level. Thank you.”
We clapped. Everyone sitting in class agreed that Steven had met the assignment. He met the time limit. He had graphics. He made a connection.
I saw something even more profound.
In less than three minutes, Steven had used what he had learned in physics to teach me a new way to consider the learning process. I could see phase changes or phase transitions to illustrate the relationship between energy expended over time and academic performance. I could relabel the side marked heat energy to a label of “energy expended over time.” Some phase changes would be short, as in the change from ice to a liquid state. Other phase changes would be longer, as in the change from liquid to gas. Each line of phase change would be different.
For example, if I applied this idea to teaching English grammar, some student phase changes would be short, as in a student’s use of pronouns to represent a noun. Other phase changes could be much longer, such as that same student employing noun-pronoun agreement. Time and energy would need to be expended to improve individual student performance on this task.
But whose energy is measured in this re-imagined transition? Perhaps the idea of phase changes could be used to explain how a teacher’s energy expended in instruction over time, or during a critical point, could improve academic performance. The same idea could be used to demonstrate how a student must expend additional energy at a critical point to improve understanding in order to advance to the next level.
At the end of the school year, teachers need to provide evidence of individual student growth, but perhaps a student is in a transitioning phase and growth is not yet evident? The major variable in measuring student achievement is the length of the critical point of transition from one level to another, and that length of that critical point could extend for the length of a school year or maybe even longer. Growth may not be measured in the time provided and more energy may need to be expended.
What was so interesting to me was how Steven’s use of phase changes had given me another lens to view the students I assess and the teachers I evaluate. Because measuring academic progress is not fixed by the same physical laws where 540 calories are needed to turn 1 gram (at 100 degrees Celsius) of water to steam, each student’s graph of academic achievement (phase changes) varies. Critical points will be at different levels of achievement measured by different lengths of energy expended. Despite the wishes of teachers, administrators, and students themselves, “growth” is rarely on that 45º trajectory. Instead, growth is represented by moving up a series of stages or critical points that illustrate the amount of energy, by student and/or teacher, spent over time.
Energy matters, in physics and in student achievement. Steven’s TEDTalk gave me a new way to think about that. He was profound. I think he gets an A.


You have summed up the dilemma of student growth charts and how learning really takes place – over a period of time, and at different rates. Thank you!
…and thanks to my student (Steven) who taught me to think off the charts!
Love your post Colette! I had a similar discussion recently about visible student growth!
Hi Colette! Great article. Your blog made me think of this quote by Vygotsky. (I just happened to read some excerpts lately.) Whereas constructivists argue that development must precede learning, Vygotsky argues that imitation in one’s zone of current development occurs for some time during that transitional phase and will not yet be measured on a standardized, independent measurement, but still counts. In a way I guess he is arguing that learning precedes developmental processes. It makes me think of the way children acquire language. They know what the words are (i.e. they have received language) and might even be able to imitate the word(s) but cannot quite yet pull all their ideas together aloud. Here’s the quote:
In L.S. Vygotsky’s book MIND IN SOCIETY, he argues:
“A full understanding of the concept of the zone of proximal development must result in reevaluation of the role of imitation in learning. An unshakable tenet of classical psychology is that only the independent activity of children, not their imitative activity, indicates their level of mental development. This view is expressed in all current testing systems. In evaluating mental development, consideration is given to only those solutions to test problems which the child reaches without the assistance of others, without demonstrations, and without leading questions. Imitation and learning are thought of as purely mechanical processes. But recently psychologists have shown that a person can imitate only that which is within her developmental level.”
He goes on to say that “children can imitate a variety of actions that go well beyond the limits of their own capabilities. Using imitation, children are capable of doing much more in collective activity or under the guidance of adults.”
This imitation, Vygotsky says is important because it leads to learning: “We propose that an essential feature of learning is that it creates the zone of proximal development, that is, learning awakens a variety of internal developmental processes that are able to operate only when the child is interacting with people in his environment and in cooperation with his peers. Once these processes are internalized, they become part of the child’s independent developmental achievement.”
Anytime I can remind people of Vygotsky without actually mentioning him I should be happy! Thank you for putting some scholarly theory behind my hypothetical.