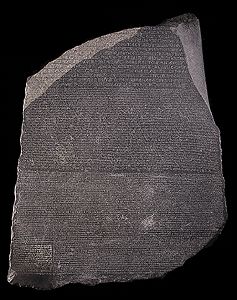
The Rosetta Stone currently located in The British Museum in London, England.
When I stood in front of the Rosetta Stone in the British Museum in London, I had to wiggle my way through the blockade of tourists who were trying to photograph the small black tablet. Since the stone was encased in glass, I knew the reflections from the camera flashes would result in poor quality photos. Once I had my few seconds before the 2200 year old tablet, I headed off to the gift shop to secure a clear photo of the Rosetta Stone and a small plaster recast of the dark black stone; both yielded far more details than I saw when I was squeezed by the crowd.
The face of the Rosetta Stone, one of two tablets, is etched with three different scripts, each spelling out the same decree issued by King Ptolemy V from Memphis (Egypt) in 196 BCE. These inscriptions translate Ptolemy’s decree in three scripts: the upper text is Ancient Egyptian hieroglyphs, the middle portion Demotic script, and the lowest Ancient Greek. Because the Rosetta Stone presented the same text in each script (with a few minor differences among them), the tablet provided the key to our modern understanding of Egyptian hieroglyphs.
Since the Rosetta Stone is often used as a metaphor for using an essential clue to a new field of knowledge, why not use the Rosetta Stone as a metaphor for explaining the role of data, specifically standardized test data, in informing classroom instruction? Imagine that different stakeholders, (school administrators, teachers, students, parents and test creators ) who look at the results of standardized tests are like those who crowd before the Rosetta Stone trying to decipher its meaning.
The first linguists who worked with the Rosetta Stone were able to look closely, touch and take rubbings of the different alphabets and hieroglyphics as they translated each of the texts. They spent time puzzling over the different alphabets, and they constructed primers to help decode each of the languages. They could see the variations in the engraver’s strokes; they could examine nuances in chisel marks that formed the symbols. As to the contents of the missing or damaged sections, the linguists made educated guesses.
Likewise, in education there are those who are knowledgeable in translating the information from standardized tests, those who have spent time examining data looking for patterns of trends comparing collective or individual student progress over time or perhaps comparing student cohorts. The metaphor of the Rosetta Stone, however, fails in directly comparing the different forms of data collected in the multitude of standardized tests. Each test or assessment is constructed as a single metric; the translations of one standardized test to another are not the same. For example, the state mandated Connecticut Mastery Tests (CMT-grades 3-8) are not correlated to a diagnostic test for reading such as a diagnostic reading assessment (DAR). The Connecticut Academic Performance Test (CAPT Grade 10) cannot be directly compared to the PSAT or ACT or the NAEP, and none of these standardized tests are comparable to each other.
Consider also how the linguists who studied the Rosetta Stone spent time and lingered over the different interpretations in order to translate the symbols in the differing alphabets. They studied a finite number of symbols that related to a finite statement fixed in time.
In contrast, standardized testing associated with education reform is on the upswing, and today’s educators must review continuous waves of incoming data. Often, when the results are finally released, their value to inform classroom instruction has been compromised. These results serve only to inform educators of what student could do months earlier, not what they are doing in real time. Just like the time stamped images each tourist’s camera records of the Rosetta Stone, standardized tests are just time stamped snapshots of past student performance.
How ironic, then, that so much media attention is given over to the results of the standardized tests in informing the public about student progress. How like the crowds snapping blurry photos around the Rosetta Stone are those who do not understand what exactly what each standardized test measures.
What they should appreciate is that prioritizing the streams of data is key to improving instruction, and the day to day collection of information in a classroom is arguably a more accurate snapshot of student ability and progress.
There are the classroom assessments that teachers record on progress reports/report cards: homework, quizzes, tests, projects that measure student achievement in meeting grade level standards and requirements. Then there is the “third leg” of data, the anecdotal data that can be used to inform instruction. The anecdotal data may be in the form of noting a student sleeping in class (“Has she been up late?”), reviewing a lesson plan that did not work (“I should have used a picture to help them understand”), or reporting a fire drill during testing (“Interruptions distracted the students”). Here the multiple forms of data collected to measure student progress are fluid and always changing, and translating these results is like the linguists’ experience of the hands-on translation of the Rosetta Stone noting the variations and nuances and making educated guesses.
The standardized tests results are most useful in determining trends, and if translated correctly, these results can help educators adjust curriculum and/or instructional strategies. But these test results are antiquated in relation to tracking student learning. Students are not the same day to day, week to week, semester to semester. Their lives are not prescribed in flat symbols, rather students live lives of constant change as they evolve, grow, and learn.
As the Rosetta Stone was critical to understanding texts of the Ancient World, our standardized tests are the “ancient texts” of contemporary education. Standardized tests cannot be the only measurement the public gets to interpret on student and school performance since the results are limited as snapshots of the past. Student and school performance is best understood in looking at the timely combination of all streams of data. To do otherwise is to look at snapshots that are narrow, unchangeable, and, like many of those photos snapped in the British Museum, overexposed.