Archives For November 30, 1999

Open House: OMG!

September 15, 2013 — 1 Comment

September is Open House Month, and the welcoming speech from a teacher could sound like this:

“Welcome, Parents! Let me show you how to access my website on the SMARTboard where you can see how the CCSS are aligned with our curriculum. You can monitor your child’s AYP by accessing our SIS system, Powerschool. In addition, all of our assignments are on the class wiki that you can access 24/7.  As we are a BYOD school, your child will need a digital device with a 7″ screen to use in class.”

OMG!

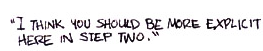
How parents may feel during Open House listening to education acronyms

The result of such a speech is that parents may feel like students all over again. The same people who sat in desks, perhaps only a few years ago, now are on another side of the classroom experience, and the rapid changes caused by the use of technology in education necessitate a need for education primer, a list of important terms to know. While attending the Open House, parents can observe that there are still bulletin boards showcasing student work. They can note how small the desks appear now, if there are desks. Perhaps the lunch lady is the same individual who doled out applesauce and tater tots onto their school lunch trays.  Yet, listening to how instruction is delivered, monitored, and accessed may make parents feel that they are in some alien experience with instructors and administrators spouting a foreign language. Just what is a wiki? they may wonder, and what does BYOD stand for?

So, let’s begin with some of the acronyms.  At Open House, educators may casually throw around some of the following terms to explain what they teach or how they measure what they teach:

  • PBL (Project Based Learning) a hands-on lesson;
  • SIS (Student Information System);
  • Bloom’s Taxonomy: a sequence of learning based on complication of task and level of critical thinking which is being replaced by the DOK;
  • DOK (Depths of Knowledge) complication of task and level of critical thinking required
  • ESL (English as a Second Language);
  • AYP (Adequate Yearly Progress);
  • WIKI: a web application which allows people to add, modify, or delete content in a collaboration with others; and
  • SMARTboard: interactive white board

Subject area names may also seem unfamiliar since they now reflect a different focus on areas in education. English is now ELA (English/Language Arts) while science and math have merged like the Transformers into the mighty STEM (Science, Technology, Engineering, and Math). The old PE class may now bear the moniker Physical Activity and Health (PAH), but  History has already dealt with the shift to the more inclusive term Social Studies coined in the 1970s.

Assessment (testing) brings about another page in the list of education acronyms that parents may hear on Open House, including these few examples:

DRP (Degrees of Reading Power) reading engagement, oral reading fluency, and comprehension younger elementary students;
DRA (Developmental Reading Assessment) reading engagement, oral reading fluency, and comprehension in elementary and middle grade students;
STAR: new skills-based test items, and new in-depth reports for screening, instructional planning, progress monitoring;
PSAT/SAT/ACT:designed to assess student academic readiness for college 

Parents, however, should be aware that they are not alone in their confusion. Educators often deal with acronym duplication, and  state by state the abbreviations may change. In Connecticut, some students have IEPs (Individual Education Plans), but all students have SSP (Student Success Profiles) which shares the same acronym with the SSP (Strategic School Profile). Connecticut introduced the teacher evaluation program SEED known as the System for Educator Evaluation and Development, which is an acronym not to be confused with SEED, a partnership with urban communities to provide educational opportunities that prepare underserved students for success in college and career.

Federal programs only add to the list of abbreviations. Since 1975, students have been taught while IDEA (Individuals with Disabilities Education Act) has been implemented. NCLB (No Child Left Behind) has been the dominating force in education for the length of the Class of 14’s time in school, along with its partner SSA (Student Success Act) which is similar to, but not exactly like, the SSP mentioned earlier. The latest initiative to enter the list of reform movements that parents should know  is known as the CCSS the Common Core State Standards.

The CCSS are academic standards developed in 2009 and adopted by 45 states in order to provide “a consistent, clear understanding of what students are expected to learn, so teachers and parents know what they need to do to help them.” Many of the concepts in the CCSS will be familiar to parents, however, the grade level at which they are introduced may be a surprise. Just as their parents may have been surprised to find the periodic tables in their 5th grade science textbooks, there are many concepts in math (algebra) and English (schema) that are being introduced as early as Kindergarten.

So when a student leaves in the morning with a digital device for school, BYOD or BYOT (Bring Your Own Technology) and sends a “text” that they will be staying late for extra help or extra-curricular activities, parents should embrace the enhanced communication that this Brave New World of technology in education is using. If at Open House a parent needs a quick explanation of the terms being used by a teacher, he should raise his hand;  in spite of all these newfangled terms and devices, that action still signals a question.

Above all, parents should get to know the most important people in the building: the school secretary (sorry, the Office Coordinator) and the school custodian (sorry, FMP: Facility Maintenance Personnel). They know where your child left her backpack.

Late August and early September means back to school for all students. Many primary school teachers are pulling out the traditional “apple” unit to welcome their students. Many of these teachers will be ready with “pumpkin”, also a fruit, for the following month of October. During the school year, teachers of all grade levels might find out that a lesson turned out to be a “lemon”, or one that is “not worth a fig.” Educational stakeholders can “cherry-pick” data to see if the efforts of a teacher “bears fruit”, while the focus on data-driven instruction can drive some teachers “bananas”.

Fruit metaphors are plentiful when discussing education, and a recent post by a friend and literacy specialist, Catherine Flynn, explains a possible reason. Consider that fruits, although uniform at first glance are, upon closer inspection, very different. Fruits flourish in different environments, and fruits require different nutrients. Fruits require different means of harvesting, and fruits ripen at different times.

blackberriesThis ripening was the point of Catherine’s blog post in her response to the Slice of Life blog challenge, a weekly prompt organized by Two Writing Teachers. Catherine’s response to their prompt on her Reading to the Core Blog was titled Ripe Blackberries.  Since she lives in a rural area, she had the opportunity to consider the ripening blackberries on a bush near her home:

 Each morning as I walk my dog, I notice that some of the fruit is deep black, as ripe as it’s going to get, while others still have just a hint of red. Why such variation on one bush? Each blackberry has gotten the same amount of rain and sun. Each one has the same genetic make up. So why are some ripening faster than others?

There are many forces in nature that cause the variations that Catherine noted as she admired the blackberry bush. These forces dictate the time for harvesting those blackberries, but this fruit is never uniformly ready for harvest at the same moment. For example, the advice for picking berries on several websites suggests that to “ensure that none of the fruit gets too ripe, berries should be picked every two or three days.” Berries are not the only fruit that may require a second or third harvest, and pinpointing the exact moment of any fruit’s maturity is a combination of science and practiced guessing.

In contrast to how nature influences fruit to ripen and mature, our educational system requires students to be “ripe” collectively at the same time, regardless of the variations in age, race, or gender of the students. The educational system measures how well a student meets a pre-determined standard through tests given on a prescribed date, picked perhaps years in advance. There is no accounting for arbitrary changes that may have happened in a school system, perhaps changes in staff, facility, or materials. There is no accounting for the arbitrary changes in a student’s personal life. Rather, there is a standardization for elements in our educational system that defies the individual nature of each student.

In her post Catherine notes:

Within every classroom, there will be a variety of strengths, abilities, and weakness. Students will arrive at school with a vastly different amounts of background knowledge and interests. Despite these differences, in the hands of a caring, knowledgable teacher in a supportive, nurturing environment, almost all children will learn and grow. Not at the same pace, and not to the same degree, but they will learn, just as most of the berries on those bushes will eventually ripen.

Screen Shot 2013-08-14 at 8.54.31 PM

Teachers see the differences in the nature of each student: the emotions, the ability, and the interests. Teachers see each student as more than a data point in achieving instruction, and teachers know that each student is more than what a test score represents. As Catherine suggests, in the hands of a caring and knowledgeable teacher, each student will learn and grow.

Yet, countering the forces in the nature of each student are the forces of educational reform that are increasing testing at every grade level. Tests focus on a limited range of skill sets with little consideration for other student aptitudes. To determine each student’s preparedness, students are bunched together by a “date of production” or birthdate, not when a student is “ripe” or cognitively mature.

Therefore, trying to compare student cognition through collective testing on any given day is the final metaphor of this post. It is like comparing apples to oranges. Yes, they are both fruit, but they are very different. So are our students.

A favorite New Yorker cartoon of mine is by Sidney Harris.

Screen Shot 2013-08-07 at 6.06.50 AMTwo men stand in front of a chalkboard. Their demeanor indicates they are mathematicians. Scrawled on the chalkboard to the left of them is step one, a complicated mathematical formula. To the right of them, step three, is the solution to that complicated formula. In the center of these numbers and symbols,one of the men is pointing to the phrase, “THEN A MIRACLE OCCURS…”.

Under the cartoon is the caption spoken by one of the mathematicians: “I think you need to be a little more explicit here in step two.”

There are so many scenarios that could be explained by this cartoon, but lately I have been thinking about how this cartoon represents the process of education. The missing “step two” is the miracle of how a teacher helps a student to learn, since by definition, a miracle is an extremely outstanding accomplishment. Good teaching is that miracle that blends both science and art. The science formula here is the diagnosis of student needs and the application of strategies that address these needs. The art is the manner in which a good teacher does both.

This blend of science and art is necessary since each student learns differently. Students’ brains are different. Students’ personalities are different. There are differences in how students mature physically and emotionally, and students’ learning styles are different. A great deal of time and energy has been expended in researching the science of teaching to address these differences.

For example, at the beginning of the 20th Century, researchers noted that those students who performed well on one type of test, say mathematics or verbal fluency, were also successful on other academic tests, while those who did poorly on one test tended to do poorly on other tests as well. British psychologist Charles Spearman, put forth a theory that a student’s mental performance across different could be consolidated in a single general ability rating, the g factor. In 1983, American developmental psychologist Howard Gardner countered with his Theory of Multiple Intelligences. He suggested that a measuring student’s intelligence should also include the following considerations:

Visual/Spatial – Involves visual perception of the environment, the ability to create and manipulate mental images, and the orientation of the body in space.
Verbal/Linguistic – Involves reading, writing, speaking, and conversing in one’s own or foreign languages.
Logical/Mathematical – Involves number and computing skills, recognizing patterns and relationships, timeliness and order, and the ability to solve different kinds of problems through logic.
Bodily/Kinesthetic – Involves physical coordination and dexterity, using fine and gross motor skills, and expressing oneself or learning through physical activities.
Musical – Involves understanding and expressing oneself through music and rhythmic movements or dance, or composing, playing, or conducting music.
Interpersonal – Involves understanding how to communicate with and understand other people and how to work collaboratively.
Intrapersonal – Involves understanding one’s inner world of emotions and thoughts, and growing in the ability to control them and work with them consciously.
Naturalist – Involves understanding the natural world of plants and animals, noticing their characteristics, and categorizing them; it generally involves keen observation and the ability to classify other things as well.

Gardner’s theory has been adopted by educators, including Sir Ken Robinson, an English author, speaker, and international advisor, who has stated that,

Many highly talented, brilliant, creative people think they’re not — because the thing they were good at at school wasn’t valued, or was actually stigmatized.

He has noted that organizing students by birthdate is not the best determiner of learning saying,

Students are educated in batches, according to age, as if the most important thing they have in common is their date of manufacture. 

Robinson advocates accounting for student differences in an educational system that has been standardized for ease of delivery, an educational system of definitions and measurement. Balancing these forces of measurement and definition in the science of good teaching demands another great force, the art of good teaching.

Good teachers practice the art of teaching in accounting for student differences in maturity, in personality, and in interest. Good teachers practice the art of teaching by choosing how to challenge or aid a student with new content. Good teachers practice the art of teaching when they distinguish between the look of confusion from a look of comprehension and respond appropriately. The art of teaching is knowing how to address the needs of the individual learner.

While there is a degree of science used in the “miracle” step two of the cartoon, the degree of art is trickier. Science is valuable to education as measuring the student; art is valuable to education because the art of teaching has an effect on the student that cannot be measured. The miracle of good teaching is a blend of the two, a blend of science and art for each individual student.

As to those mathematicians in the cartoon who need to be more explicit in step two? They should ask a teacher about performing miracles.

Rosetta

The Rosetta Stone currently located in The British Museum in London, England.

When I stood in front of the Rosetta Stone in the British Museum in London, I had to wiggle my way through the blockade of tourists who were trying to photograph the small black tablet. Since the stone was encased in glass, I knew the reflections from the camera flashes would result in poor quality photos. Once I had my few seconds before the 2200 year old tablet, I headed off to the gift shop to secure a clear photo of the Rosetta Stone and a small plaster recast of the dark black stone; both yielded far more details than I saw when I was squeezed by the crowd.

The face of the Rosetta Stone, one of two tablets, is etched with three different scripts, each spelling out the same decree issued by King Ptolemy V from Memphis (Egypt) in 196 BCE. These inscriptions translate Ptolemy’s decree in three scripts: the upper text is Ancient Egyptian hieroglyphs, the middle portion Demotic script, and the lowest Ancient Greek. Because the Rosetta Stone presented the same text in each script (with a few minor differences among them), the tablet provided the key to our modern understanding of Egyptian hieroglyphs.

Since the Rosetta Stone is often used as a metaphor for using an essential clue to a new field of knowledge, why not use the Rosetta Stone as a metaphor for explaining the role of data, specifically standardized test data, in informing classroom instruction? Imagine that different stakeholders, (school administrators, teachers, students, parents and test creators ) who look at the results of standardized tests are like those who crowd before the Rosetta Stone trying to decipher its meaning.

The first linguists who worked with the Rosetta Stone were able to look closely, touch and take rubbings of the different alphabets and hieroglyphics as they translated each of the texts. They spent time puzzling over the different alphabets, and they constructed primers to help decode each of the languages. They could see the variations in the engraver’s strokes; they could examine nuances in chisel marks that formed the symbols. As to the contents of the missing or damaged sections, the linguists made educated guesses.

Likewise, in education there are those who are knowledgeable in translating the information from standardized tests, those who have spent time examining data looking for patterns of trends comparing collective or individual student progress over time or perhaps comparing student cohorts. The metaphor of the Rosetta Stone, however, fails in directly comparing the different forms of data collected in the multitude of standardized tests. Each test or assessment is constructed as a single metric; the translations of one standardized test to another are not the same. For example, the state mandated Connecticut Mastery Tests (CMT-grades 3-8)  are not correlated to a diagnostic test for reading such as a diagnostic reading assessment (DAR). The Connecticut Academic Performance Test (CAPT Grade 10) cannot be directly compared to the PSAT or ACT or the NAEP, and none of these standardized tests are comparable to each other.

Consider also how the linguists who studied the Rosetta Stone spent time and lingered over the different interpretations in order to translate the symbols in the differing alphabets. They studied a finite number of symbols that related to a finite statement fixed in time.

In contrast, standardized testing associated with education reform is on the upswing, and today’s educators must review continuous waves of incoming data. Often, when the results are finally released, their value to inform classroom instruction has been compromised. These results serve only to inform educators of what student could do months earlier, not what they are doing in real time. Just like the time stamped images each tourist’s camera records of the Rosetta Stone, standardized tests are just time stamped snapshots of past student performance.

How ironic, then, that so much media attention is given over to the results of the standardized tests in informing the public about student progress. How like the crowds snapping blurry photos around the Rosetta Stone are those who do not understand what exactly what each standardized test measures.

What they should appreciate is that prioritizing the streams of data is key to improving instruction, and the day to day collection of information in a classroom is arguably a more accurate snapshot of student ability and progress.

There are the classroom assessments that teachers record on progress reports/report cards: homework, quizzes, tests, projects that measure student achievement in meeting grade level standards and requirements. Then there is the “third leg” of data, the anecdotal data that can be used to inform instruction. The anecdotal data may be in the form of noting a student sleeping in class (“Has she been up late?”), reviewing a lesson plan that did not work (“I should have used a picture to help them understand”), or reporting a fire drill during testing (“Interruptions distracted the students”). Here the multiple forms of data collected to measure student progress are fluid and always changing, and translating these results is like the linguists’ experience of the hands-on translation of the Rosetta Stone noting the variations and nuances and making educated guesses.

The standardized tests results are most useful in determining trends, and if translated correctly, these results can help educators adjust curriculum and/or instructional strategies. But these test results are antiquated in relation to tracking student learning. Students are not the same day to day, week to week, semester to semester. Their lives are not prescribed in flat symbols, rather students live lives of constant change as they evolve, grow, and learn.

As the Rosetta Stone was critical to understanding texts of the Ancient World, our standardized tests are the “ancient texts” of contemporary education. Standardized tests cannot be the only measurement the public gets to interpret on student and school performance since the results are limited as snapshots of the past. Student and school performance is best understood in looking at the timely combination of all streams of data. To do otherwise is to look at snapshots that are narrow, unchangeable, and, like many of those photos snapped in the British Museum, overexposed.

The “Nation’s Report Card” is released by The National Assessment of Educational Progress (NAEP) every year where students are tested at ages 9, 13, and 17. This past year, the testing results for readers at age 17 were abysmal, demonstrating only a 2% growth in reading scores over the past 41 years.

I was bemoaning this statistic to a friend who responded, “Well, they are just seventeen…”
Almost immediately, I heard the voice of Paul McCartney, the voice of my youth, respond in my brain, “…you know what I mean….”

Well, she was just seventeen,
You know what I mean,
And the way she looked was way beyond compare.
So how could I dance with another, (Ooh)
And I saw her standing there.

Seventeen is that age of great contradictions…you know what I mean? For example:

  • Seventeen is the year before legal adulthood in the USA;
  • Seventeen is the age at which one may watch, rent, or purchase R-rated movies without parental consent;
  • Seventeen is the age at which one can enlist in the armed forces with parental permission;
  • More 17-year-olds commit crimes than any other age group, according to recent studies by psychiatrists.

Nature also provides an example of frenetic activity that can happen in one seventeen year cycle. Consider that cicadas remain buried for seventeen years before coming out and breaking into their mating song. Coincidently there are quite a number of songs, mating or otherwise, that center their message on how it feels to be seventeen.

There is the raw sexuality in Paradise By the Dashboard Light by Meat Loaf:

Though it’s cold and lonely in the deep dark night
I can see paradise by the dashboard light
[Girl:]
Ain’t no doubt about it we were doubly blessed
‘Cause we were barely seventeen
And we were barely dressed

Similarly, the Cars exhort the passions of seventeen in their song Let’s Go:

she’s winding them down
on her clock machine
and she won’t give up
’cause she’s seventeen
she’s a frozen fire
she’s my one desire

Glam rock band Winger also offers a robust cicada-like mating call for their song Seventeen:

I’m only seventeen
But I”ll show you love like you’ve never seen
She’s only seventeen
Daddy says she’s too young

There are songs that address the restlessness of seventeen such as Edge of Seventeen by Stevie Nicks:

He was no more than a baby then
Well, he seemed broken hearted, something within him
But the moment that I first laid eyes on him all alone
On the edge of seventeen

While Rod Stewart adds a cautionary tale of runaway seventeen-year-olds to his song Young Turks:

Billy left his home with a dollar in his pocket and a head full of dreams.
He said somehow, some way, it’s gotta get better than this.
Patti packed her bags, left a note for her momma, she was just seventeen,
There were tears in her eyes when she kissed her little sister goodbye.

Emotional pain is explored in Janis Ian’s heartbreaking  At Seventeen 

I leaned the truth at seventeen
That love was meant for beauty queens
And high school girls with clear-skinned smiles
Who married young and then retired

In contrast, however, adults are nostalgic for the age in Frank Sinatra’s It Was a Very Good Year:

When I was seventeen
It was a very good year
for small town girls
And soft summer nights
We’d hide from the lights
On the village green
When I was seventeen

Seventeen is an age of complications. Don’t even get me started on Rogers and Hammerstein’s I am Sixteen Going on Seventeen from The Sound of Music; poor Lisel has Nazi problems in her secret romance!

Each song, (and yes, I know there are many others) explores the multitude of contradictions in being seventeen. Collectively, the lyrics show how seventeen is a seething ferment of frustration, experimenting, wishing, waiting, and wanting; a potent potion for those tipping into adulthood.

And this is the targeted population for nationwide testing?

Therefore, when the annual sample of seventeen year olds is selected to take the NAEP test in order to diagnosis the reading level of the nation’s seventeen year olds, I wonder, how invested are they in this task? These are the students who have been state standardized tested at every grade level, they have been PSAT, SAT or ACT tested, and maybe Advanced Placement tested. What does this extra test, with no impact on their GPA, mean to them?

I wonder if they simply fill out the letters A-B-B-A on the multiple choice just to have test done? Which reminds me,  ABBA also has a seventeen themed song, Dancing Queen: 

You are the Dancing Queen, young and sweet, only seventeen
Dancing Queen, feel the beat from the tambourine
You can dance, you can jive, having the time of your life
See that girl, watch that scene, digging the Dancing Queen

So what did the Beatles mean when they sang, Well, she was just seventeen, you know what I mean?

On the compilation album Anthology, Paul admits that he and John were also stumped in trying to define the complexity of being seventeen in the lyrics to I Saw Her Standing There:

We were learning our skill. John would like some of my lines and not others. He liked most of what I did, but there would sometimes be a cringe line, such as, ‘She was just seventeen, she’d never been a beauty queen.’ John thought, ‘Beauty queen? Ugh.’ We were thinking of Butlins so we asked ourselves, what should it be? We came up with, ‘You know what I mean.’ Which was good, because you don’t know what I mean.

Maybe we should take this advice from Paul and John and all the other recording artists. Maybe the only thing we are testing for the past 41 years is how seventeen year olds test the same in every generation. Maybe just being seventeen means confronting more immediate problems, and these problems do not include taking a NAEP test.

Maybe there should be some variable or some emotional handicap considered for testing at age seventeen …you know what I mean?I saw her

The release of the National Assessment of Educational Progress (NAEP) Progress Report for 2012  (“Nation’s Report Card”) provides an overview on the progress made by specific age groups in public and private schools in reading and in mathematics since the early 1970s. The gain in reading scores after spending billions of dollars, countless hours and effort was a measly 2% rise in scores for 17-year-olds. After 41 years of testing, the data on the graphs show a minimal 2% growth. After 41 years, Einstein’s statement, “Insanity is doing the same thing repeatedly and expecting different results,” is a confirmation that efforts in developing effective reading programs have left the education system insane.

The rather depressing news from NAEP in reading scores (detailed in a previous blog) could be offset, however, by information included in additional statistics in the report. These statistics measure the impact of “reading for fun” on student test scores. Not surprisingly, the students who read more independently, scored higher. NAEP states:

Results from previous NAEP reading assessments show students who read for fun more frequently had higher average scores. Results from the 2012 long-term trend assessment also reflect this pattern. At all three ages, students who reported reading for fun almost daily or once or twice a week scored higher than did students who reported reading for fun a few times a year or less

The irony is that reading for fun is not measured in levels or for specific standards as they are in the standardized tests. For example, the responses in standardized tests are measured accordingly:

High Level readers:

  • Extend the information in a short historical passage to provide comparisons (CR – ages 9 and 13)
  • Provide a text-based description of the key steps in a process (CR)
  • Make an inference to recognize a non-explicit cause in an expository passage (MC – age 13)
  • Provide a description that includes the key aspects of a passage topic (CR – ages 9 and 13)

Mid Range Readers:

  • Read a highly detailed schedule to locate specific information (MC – age 13)
  • Provide a description that reflects the main idea of a science passage (CR – ages 9 and 13)
  • Infer the meaning of a supporting idea in a biographical sketch (MC – ages 9 and 13)
  • Use understanding of a poem to recognize the best description of the poem’s speaker (MC)

Low Level Readers:

  • Summarize the main ideas in an expository passage to provide a description (CR – ages 9 and 13)
  • Support an opinion about a story using details (CR – ages 9 and 13)
  • Recognize an explicitly stated reason in a highly detailed description (MC)
  • Recognize a character’s feeling in a short narrative passage (MC – age 13)

(CR Constructed-response question /MC Multiple-choice question)

Independent reading, in contrast, is deliberately void of any assessment. Students may choose to participate in a discussion or keep a log on their own, but that is their choice.  The only measurement is a student’s willingness to volunteer the frequency of their reading, a form of anecdotal data.

According to the graph below (age 17 only), students who volunteered that they read less frequently were in the low to mid-level ranges in reading. Students who volunteered that they read everyday met the standards at the top of the reading scale.

Graph showing that 17-year-olds who read for fun score higher on standardized tests

#1 Graph showing that 17-year-olds who read for fun score higher on standardized tests

Sadly, this NAEP data recorded a decline in reading for fun over the last 17 years-exactly the age of those students who have demonstrated only a 2% increase in reading ability. The high number of independent readers (“reading for fun”) was in 1994 at 30%.

Steady decline  in the number of 17- year-old students who say that they  "read for fun."

#2 Steady decline in the number of 17- year-old students who say that they “read for fun.”

So what happened the following years, in 1995 and 1996, to cause the drop in students who read voluntarily? What has happened to facilitate the steady decline?

In 1995 there were many voices advocating independent reading: Richard Allington, Stephen Krashen, and Robert Marzano. The value of independent reading had been researched and was being recommended to all districts.

Profit for testing companies or publishing companies, however, is not the motive in independent reading programs.There are no “scripted” or packaged or leveled programs to offer when students choose to “read for fun”, and there is no test that can be developed in order to report a score on an independent read. The numerical correlation of reading independently and higher test scores (ex: read 150 pages=3 points) is not individually measurable; and districts, parents, and even students are conditioned to receiving a score. Could the increase of reading programs from educational publishers with leveled reading box sets or reading software, all implemented in the early 1990s, be a factor?

Or perhaps the controversy on whole language vs. phonics, a controversy that raged during the 1990s, was a factor? Whole language was increasingly controversial, and reading instructional strategies were being revised to either remove whole language entirely or blend instruction with the more traditional phonics approach.

The sad truth is that there was plenty of research by 1995 to support a focus on independent “reading for fun” in a balanced literacy program, for example:

Yet seventeen years later, as detailed in the NAEP report of 2012, the scores for 17-year-old students who read independently for fun dropped to the lowest level of 19%. (chart #2)

While the scores from standardized testing over 41 years according to the NAEP report show only 2% growth in reading, the no cost independent “reading for fun” factor has proven to have a benefit on improving reading scores. Chart #1 shows a difference of 30 points out of a standardized test score of 500 or a 6% difference in scores between students who do not read to those who read daily. Based on the data in NAEP’s report, reading programs have been costly and yielded abysmal results, but letting students choose to “read for fun” has been far less costly and reflects a gain in reading scores.

The solution to breaking this cycle is given by the authors of The Nation’s Report Card. Ironically, these authors are assessment experts, data collectors, who have INCLUDED a strategy that is largely anecdotal, a strategy that can only be measured by students volunteering information about how often they read.

The choice to include the solution of “reading for fun” is up to all stakeholders-districts, educators, parents, students. If “reading for fun” has yielded the positive outcomes, then this solution should take priority in all reading programs. If not, then we are as insane as Einstein said; in trying to raise reading scores through the continued use of reading programs that have proven to be unsuccessful, we are “doing the same thing repeatedly and expecting different results.”

I recently had to write a position statement on assessment and evaluation.  The timing of this assignment, June 2013, coincided with the release of the National Assessment of Educational Progress (NAEP) Progress Report for 2012. This “Nation’s Report Card” provides an overview on the progress made by specific age groups in public and private schools in reading and in mathematics since the early 1970s.

Since NAEP uses the results of standardized tests, and those standardized tests use multiple choice questions, here is my multiple choice question for consideration:

Based on the 2012 NAEP Report results, what difference(s) in reading scores separates a 17-year-old high school student in 1971 from a 17-year-old high school student in 2012?

a. 41 years
b. billions in dollars spent in training, teaching, and testing
c. a 2 % overall difference in growth in reading
d. all of the above

You could act on your most skeptical instincts about the costs and ineffectiveness of standardized testing and make a calculated guess from the title of this blog post or you could skim the 57 page report (replete with charts, graphs, graphics, etc) that does not take long to read, so you could get the information quickly to answer correctly: choice “D”.

Yes, 41 years later, a 17-year old scores only 2% higher than a previous generation that probably contained his or her parents.

There have been billions of dollars invested in developing reading skills for our nation’s children. In just the last twelve years, there has been the federal effort in the form of Reading First, the literacy component of President Bush’s 2001 “No Child Left Behind” Act. Reading First initially offered over $6 billion to fund scientifically based reading-improvement efforts in five key early reading skills: phonemic awareness, phonics, fluency, vocabulary, and comprehension. The funding of grants for students enrolled in kindergarten through grade three in Title I Schools began in 2002-2003.

There have been individual state initiatives that complement Reading First, funded by state legislatures, such as:

There have been efforts to improve literacy made by non-profit educational corporations/foundations such as The Children’s Literacy Initiative, the National Reading Panel, and a Born to Read initiative from the American Library Association. In addition, there have been a host of policy statements from The National Council of Teachers of English and programs offered by the National Writing Project that have helped to drive attention towards the importance of reading.

All of these initiatives drove publishers of educational materials to create programs, materials and resources for educators to use. Unfortunately, the question of which reading program would prove most effective (Direct Instruction, Reading Recovery, Success for All and others) became a tangled controversy as charges of conflicts of interest between the consultants who had been hired by the Department of Education (DOE) and who trained teachers and state department of education personnel had also authored reading programs for curriculum. Fuel to this controversy was added when a review in 2006 by the DOE’s Inspector General suggested that the personnel in the DOE had frequently tried to dictate which curriculum schools must use with Reading First grant money.

Trying to improve our our students’ reading scores has been the focus so much so that our education systems have been awash in funding, materials, initiatives and controversies since 2001 in our collective to improve reading for students…and the result?

The result is a measly 2% of growth in reading for those leaving our school systems.

The evidence for this statement has been tracked by NAEP, an organization that has been assessing the progress of  9-, 13-, and 17-year-olds in reading. The graphs below taken from the NAEP report measure annual growth at each age level at the high level 250, mid level 200, and low level 150 of reading.  There are other levels measured for highest or lowest achieving students, but the levels measured on the graphs levels are correlated to the following descriptions:

LEVEL 250: Interrelate Ideas and Make Generalizations
Readers at this level use intermediate skills and strategies to search for, locate, and organize the information they find in relatively lengthy passages and can recognize paraphrases of what they have read. They can also make inferences and reach generalizations about main ideas and the author’s purpose from passages dealing with literature, science, and social studies. Performance at this level suggests the ability to search for specific information, interrelate ideas, and make generalizations.

LEVEL 200: Demonstrate Partially Developed Skills and Understanding
Readers at this level can locate and identify facts from simple informational paragraphs, stories, and news articles. In addition, they can combine ideas and make inferences based on short, uncomplicated passages. Performance at this level suggests the ability to understand specific or sequentially related information.

LEVEL 150: Carry Out Simple, Discrete Reading Tasks
Readers at this level can follow brief written directions. They can also select words, phrases, 9 or sentences to describe a simple picture and can interpret simple written clues to identify a common object. Performance at this level suggests the ability to carry out simple, discrete reading tasks.

Screen Shot 2013-06-29 at 7.52.04 PM

The NAEP report does offer some positive developments. For example, from 1971-2012, reading scores for 9-year-olds have seen an increase of 5% in students reading at the lower (150) level, an increase of 15% for students reading at mid-range (200), and an increase of 6% for students reading at the higher (250) level.

Screen Shot 2013-06-29 at 7.52.16 PMSimilarly, reading scores for 13-year olds have increased 8% for students reading at mid-level, and 5% for students at the higher level. Scores for student reading at the lower level, however, saw a negligible increase of only 1%.

At this point, I should note that the NAEP report does contain some positive finding. For example, the measurements indicate that the gaps for racial/ethnic groups did narrow in reading over the past 41 years. According to the report:

Even though White students continued to score 21 or more points higher on average than Black and Hispanic students in 2012, the White – Black and White – Hispanic gaps narrowed in comparison to the gaps in the 1970s at all three ages. The White – Black score gaps for 9- and 17-year-olds in 2012 were nearly half the size of the gaps in 1971.

Unfortunately, even that positive information should be considered with the understanding that most of these gains for racial and ethnic groups were accomplished before 2004.

Finally, for students leaving public and private school systems, the overall news is depressing. Any gains in reading in ages 9 and 13, were flattened by age 17. The growth for students reading at higher level dropped from 7% to 6%, while the  percentage of mid-range readers remained the same at 39%. The gains of 3% were in the scores of lower range readers, from 79% to 82%. Considering the loss of 1% at the higher end, the overall growth in measurement is that measly 2%.

Screen Shot 2013-06-29 at 7.55.37 PM

That’s it. A financial comparison would be a  yield $.02 for every dollar we have invested. Another comparison is that for every 100 students, only two have demonstrated improvement after 13 years of education.

Assessing the last 12 of the 41 years of measuring reading initiatives illustrates that there has been no real progress in reading as measured by standardized tests in our public and private education institutions grades K-12. NAEP’s recounting of the results after considerable funding, legislation, and effort, is as Shakespeare said, “a tale…full of sound and fury, signifying nothing.”

Continue Reading…

ScantronThe New York State Department of Education’s new standardized tests were administered last week. The tests for grades 3-8 were developed by the educational testing company Pearson and contained new “authentic” passages aligned to the new Common Core State Standards. State tests might have been routine news had not several teachers also noticed that the English Language Arts “authentic” passages mentioned products and trademark names including Mug ©Root Beer and Lego ©.

Product placement on standardized tests in elementary schools is bigger news. The public has grown accustomed to advertisements on webpages, before videos, on scoreboards, and with the well-placed beverage during a movie. Subtle and direct advertising to the youth market to develop brand loyalty at an early age is the goal of almost every corporation.

Consider a survey by Piper Jaffray, a leading investment bank and asset management firm, the  “Taking Stock With Teens” survey (taken March 1–April 3, 2013), that gathered input from approximately 5,200 teens (average age of 16.3 years). The survey is used to determine trends, and the most recent results note:

“Spending has moderated across discretionary categories for both upper-income and average-income teens when compared to the prior year and prior season. Yet nearly two-thirds of respondents view the economy as consistent to improving, and just over half signaled an intent to spend ‘more’ on key categories of interest, particularly fashion and status brand merchandise.”

Much attention, therefore, is placed on the youth market, and product placement on standardized testing could be a new marketing strategy. For example, corporations in the fashion industry could read this report and be inclined to offer some news stories or commission a short story that mentioned clothing brand names in the future to Pearson or another testing company in order to provide “authentic” passages. What better opportunity for corporations to build brand loyalty then to an audience, captive in a classroom during a state-mandated test?

The education reporter for the Washington Post, Valerie Strauss, reported on the “authentic” passages that mentioned products as “author’s choices”; Pearson’s response to her query:

As part of our partnership with NYSED, Pearson searches for previously published passages that will support grade-level appropriate items for use in the 3-8 ELA assessments. The passages must meet certain criteria agreed upon by both NYSED and Pearson in order to best align to Common Core State Standards and be robust enough to support the development of items. Once passages are approved, Pearson follows legal protocols to procure the rights to use the published passages on the assessment on behalf of NYSED. If a fee is required to obtain permission, Pearson pays this fee. NYSED has ultimate approval of passages used on the assessment.

Strauss’s report, “New Standardized Tests Feature Plugs for Commercial Products” also indicated that this practice is not exclusive to NY, and that “several different assessment programs have instances of brand names included due to use of authentic texts.” There were no specifics mentioned.

Following up with the NY Department of Education, Beth Fertig from the blog Schoolbook (WNYC),  Stories from the Front Line of Testing asked about the recent product placement:

“This is the first time we have had 100 percent authentic texts on the assessments,” said spokesman Tom Dunn. “They were selected as appropriate to measure the ELA standards. Any brand names that occurred in them were incidental and were cited according to publishing conventions. No one was paid for product placements.”

Perhaps no one was paid this year, but an unwritten taboo was broken with these standardized test. The New York Post reported one teacher response in the article  “Learn ABC’s – & IBM’s: Products in Kid Exams” by Yoav Gonen and Georgett Roberts

“I’ve been giving this test for eight years and have never seen the test drop trademarked names in passages — let alone note the trademark at the bottom of the page,” said one teacher who administered the exam.

They also reported that other commercial enterprises including the TV show “Teen Titans” and the international soccer brand FIFA  were also included on the tests.

While gaining the loyalty of the youth market is a necessary step for major corporations, the appearance of these brands on standardized tests brings our students one step closer to the future as envisioned by Stephen Spielberg in the film Minority Report. In one scene, the fugitive John Anderton (Tom Cruise) walks along a corridor while animated billboards market directly to him by calling his name:

The possibility of this kind of marketing exists and perhaps personalized advertising will call to us everyday; a cacophony of advertisements designed to keep brand names in our consciousness. Similarly, even the youngest students are the target of marketing campaigns as part of any corporation’s long term economic strategy; advertisements on multiple platforms are the “white noise” of their lives. So frequent are advertisements in students’ lives that any product placement, paid or unpaid, on these standardized tests may contribute to the definition of what is “authentic”. Students are exposed to ads so frequently and in so many genres that a text is not real without some brand name mentioned.

And if that product placement is a small part of what makes a passage “authentic” on a standardized test, can talking “authentic” billboards in the school hallways be far behind?

This post completes a trilogy of reflections on the Connecticut Academic Performance Test (CAPT) which will be terminated once the new Smarter Balance Assessments tied to the Common Core State Standards (CCSS) are implemented. There will be at least one more year of the same CAPT assessments, specifically the Interdisciplinary Writing Prompt (IW) where 10th grade students write a persusive essay in response to news articles. While the horribly misnamed Response to Literature (RTL) prompt confuses students as to how to truthfully evaluate an story and drives students into “making stories up” in order to respond to a question, the IW shallowly addresses persuasive writing with prompts that have little academic value.

According to the CAPT Handbook (3rd Generation) on the CT State Department of Eduction’s website, the IW uses authentic nonfiction texts that have been:

“… published and are informational and persuasive, 700-1,000 words each in length, and at a 10th-grade reading level.  The texts represent varied content areas (e.g., newspaper, magazine, and online articles, journals, speeches, reports, summaries, interviews, memos, letters, reviews, government documents, workplace and consumer materials, and editorials).  The texts support both the pro and con side of the introduced issue.  Every effort is made to ensure the nonfiction texts are contemporary, multicultural, engaging, appropriate for statewide implementation, and void of any stereotyping or bias.  Each text may include corresponding maps, charts, graphs, and tables.”

Rather than teach this assessment in English, interdisciplinary writing is taught in social studies because the subject of social studies is already interdisciplinary. The big tent of social studies includes elements of economics, biography, law, statistics, theology, philosophy, geography, sociology, psychology, anthropology, political science and, of course, history. Generally, 9th and 10 grade students study the Ancient World through Modern European World (through WWII) in social studies. Some schools may offer civics in grade 10.

Social studies teachers always struggle to capture the breadth of history, usually Western Civilization, in two years. However, for 15 months before the CAPT, social studies teachers must also prepare students to write for the IW test. But does the IW reflect any of the content rich material in social studies class? No, the IW does not. Instead the IW prompt is developed on some “student centered” contemporary issue. For example, past prompts have included:

  • Should students be able to purchase chocolate milk in school?
  • Should utility companies construct wind farms in locations where windmills may impact scenery or wildlife?
  • Should ATVs be allowed in Yellowstone Park?
  • Should the school day start later?
  • Should an athlete who commits a crime be allowed to participate on a sports team?
  • Should there be random drug testing of high school students?

On the English section of the test, there are responses dealing with theme, character and plot. On the science section, the life, physical and earth sciences are woven together in a scientific inquiry. On the math section, numeracy is tested in problem-solving. In contrast to these disciplines, the social studies section, the IW, has little or nothing to do with the subject content. Students only need to write persuasively on ANY topic:

For each test, a student must respond to one task, composed of a contemporary issue with two sources representing pro/con perspectives on the issue.  The task requires a student to take a position on the issue, either pro or con.  A student must support his or her position with information from both sources.  A student, for example, may be asked to draft a letter to his or her congressperson, prepare an editorial for a newspaper, or attempt to persuade a particular audience to adopt a particular position.  The task assesses a student’s ability to respond to five assessed dimensions in relationship to the nonfiction text: (1) take a clear position on the issue, (2) support the position with accurate and relevant information from the source materials, (3) use information from all of the source materials, (4) organize ideas logically and effectively, and (5) express ideas in one’s own words with clarity and fluency.

The “authentic” portions of this test are the news articles, but the released materials illustrate that these news articles are never completely one-sided; if they are written well, they already include a counter-position.  Therefore, students are regurgitating already highly filtered arguments. Secondly, the student responses never find their way into the hands of the legislators or newspaper editors, so the responses are not authentic in their delivery. Finally, because these prompts have little to do with social studies, valuable time that could be used to improve student content knowledge of history is being lost.  Some teachers use historical content to practice writing skills, but there is always instructional time used to practice with released exam materials.

Why are students asked to argue about the length of a school day when, if presented with enough information, they could argue a position that reflects what they are learning in social studies? If they are provided the same kinds of newspaper, magazine, and online articles, journals, speeches, reports, summaries, interviews, memos, letters, reviews, government documents, workplace and consumer materials, and editorials, could students write persuasive essays with social studies content that is measurable? Most certainly. Students could argue whether they would support a government like Athens or a government like Sparta. Students could be provided brief biographies and statements of belief for different philosophers to argue who they would prefer as a teacher, DesCartes or Hegel. Students could write persuasively about which amendment of the United States Constitution they believe needs to be revisited, Amendment 10 (State’s Rights) or Amendment 27 (Limiting Changes to Congressional Pay).

How unfortunate that such forgettable issues as chocolate milk or ATVs are considered worthy of determining a student’s ability to write persuasively. How inauthentic to encourage students to write to a legislator or editor and then do nothing with the students’ opinions. How depressing to know that the time and opportunity to teach and to measure a student’s understanding of the rich content of social studies is lost every year with IW test preparation.

coffeetalkMaybe the writers of the CAPT IW prompt should have taken a lesson from the writers of Saturday Night Live with the Coffee Talk with Michael Myers. In these sketches, Myers played Linda Richmond, host of the call-in talk show “Coffee Talk”. When s(he) would become too emotional (or feclempt or pheklempt ) to talk, s(he) would “give a topic” to talk “amoungst yourselves”.  Holding back tears, waving red nails in front of his face furiously, Myers would gasp out one of the following:

“The Holy Roman Empire was neither holy, Roman, nor an empire….Discuss…”

“Franklin Delano Roosevelt’s New Deal was neither new nor a deal…. Discuss…”

“The radical reconstruction of the South was neither radical nor a reconstruction…. Discuss…”

“The internal combustion engine was neither internal nor a combustion engine…. Discuss…”

If a comedy show can come up with these academic topics for laughs, why can’t students answer them for real? At least they would understand what made the sketches funny, and that understanding would be authentic.

As the Connecticut State Standardized tests fade into the sunset, teachers are learning to say “Good-bye” to all those questions that ask the reader to make a personal connection to a story. The incoming  English Language Arts Common Core Standards (ELA- CCSS) are eradicating the writing of responses that begin with, “This story reminds me of…..” Those text to self, text to text, and text to world connections that students have made at each grade level are being jettisoned. The newly designed state assessment tests will tolerate no more fluff; evidence based responses only, please.

sunsetPerhaps this hard line attitude towards literacy is necessary correction. Many literacy experts had promoted connections to increase a reader’s engagement with a text. For example,

 “Tell about the connections that you made while reading the book. Tell how it reminds you of yourself, of people you know, or of something that happened in your life. It might remind you of other books, especially the characters, the events, or the setting” (Guiding Readers and Writers Grades 3-6, Fountas and Pinnell) 

Unfortunately, the question became over-used, asked for almost every book at each grade level. Of course, many students did not have similar personal experiences to make a connection with each and every text. (Note: Given some of the dark literature-vampies, zombies- that adolescents favor, not having personal experience may be a good sign!) Other students did not have enough reading experience or the sophistication to see how the themes in one text were similar to themes in another text.  Some of the state assessment exemplars revealed how students often made limited or literal connections, for example:”The story has a dog; I have a dog.”

The requirement to make a connection to each and every story eventually led to intellectual dishonesty.  Students who were unable to call to mind an authentic connection faked a relationship or an experience. Some students claimed they were encouraged by their teachers to “pretend” they knew someone just like a character they read about. “Imagine a friend had the same problem,” they were told.   Compounding this problem was the inclusion of this connection question on the state standardized tests, the CAPT (grade 10) and the CMT (grades 3-8). So, some  students traded story for story in their responses, and they became amazingly creative in answering this question. I mentioned this in a previous post when a student told me that the sick relative he had written about in a response didn’t really exist. “Don’t worry,” he said brightly after I offered my condolences, “I made that up!”

Last week, our 9th grade students took a practice standardized test with the “make a connection question” as a prompt. They still need to practice since there is one more year of this prompt before ELA CCSS assessments are in place. The students wrote their responses to a story where the relationship between a mother and daughter is very strained. One of the students wrote about her deteriorating and very difficult relationship with her mother. I was surprised to read how this student had become so depressed and upset about her relationship with her mother. I was even more surprised that afternoon when that same mother called to discuss her daughter’s grade. I hesitated a little, but I decided to share what was written in the essay as a possible explanation. The next day, I received the following e-mail,

“I told M___that I read the practice test where she said I didn’t have time to talk and other things were more important. She just laughed and said that she had nothing in common with the girl in the story so she just made that up because she had to write something. We had a good laugh over that and I felt so relieved that she didn’t feel that way.”

After reading so many student “make a connection” essays, I should have seen that coming!

Good-bye, “Make a Connection” question. Ours was an inauthentic relationship; you were just faking it.